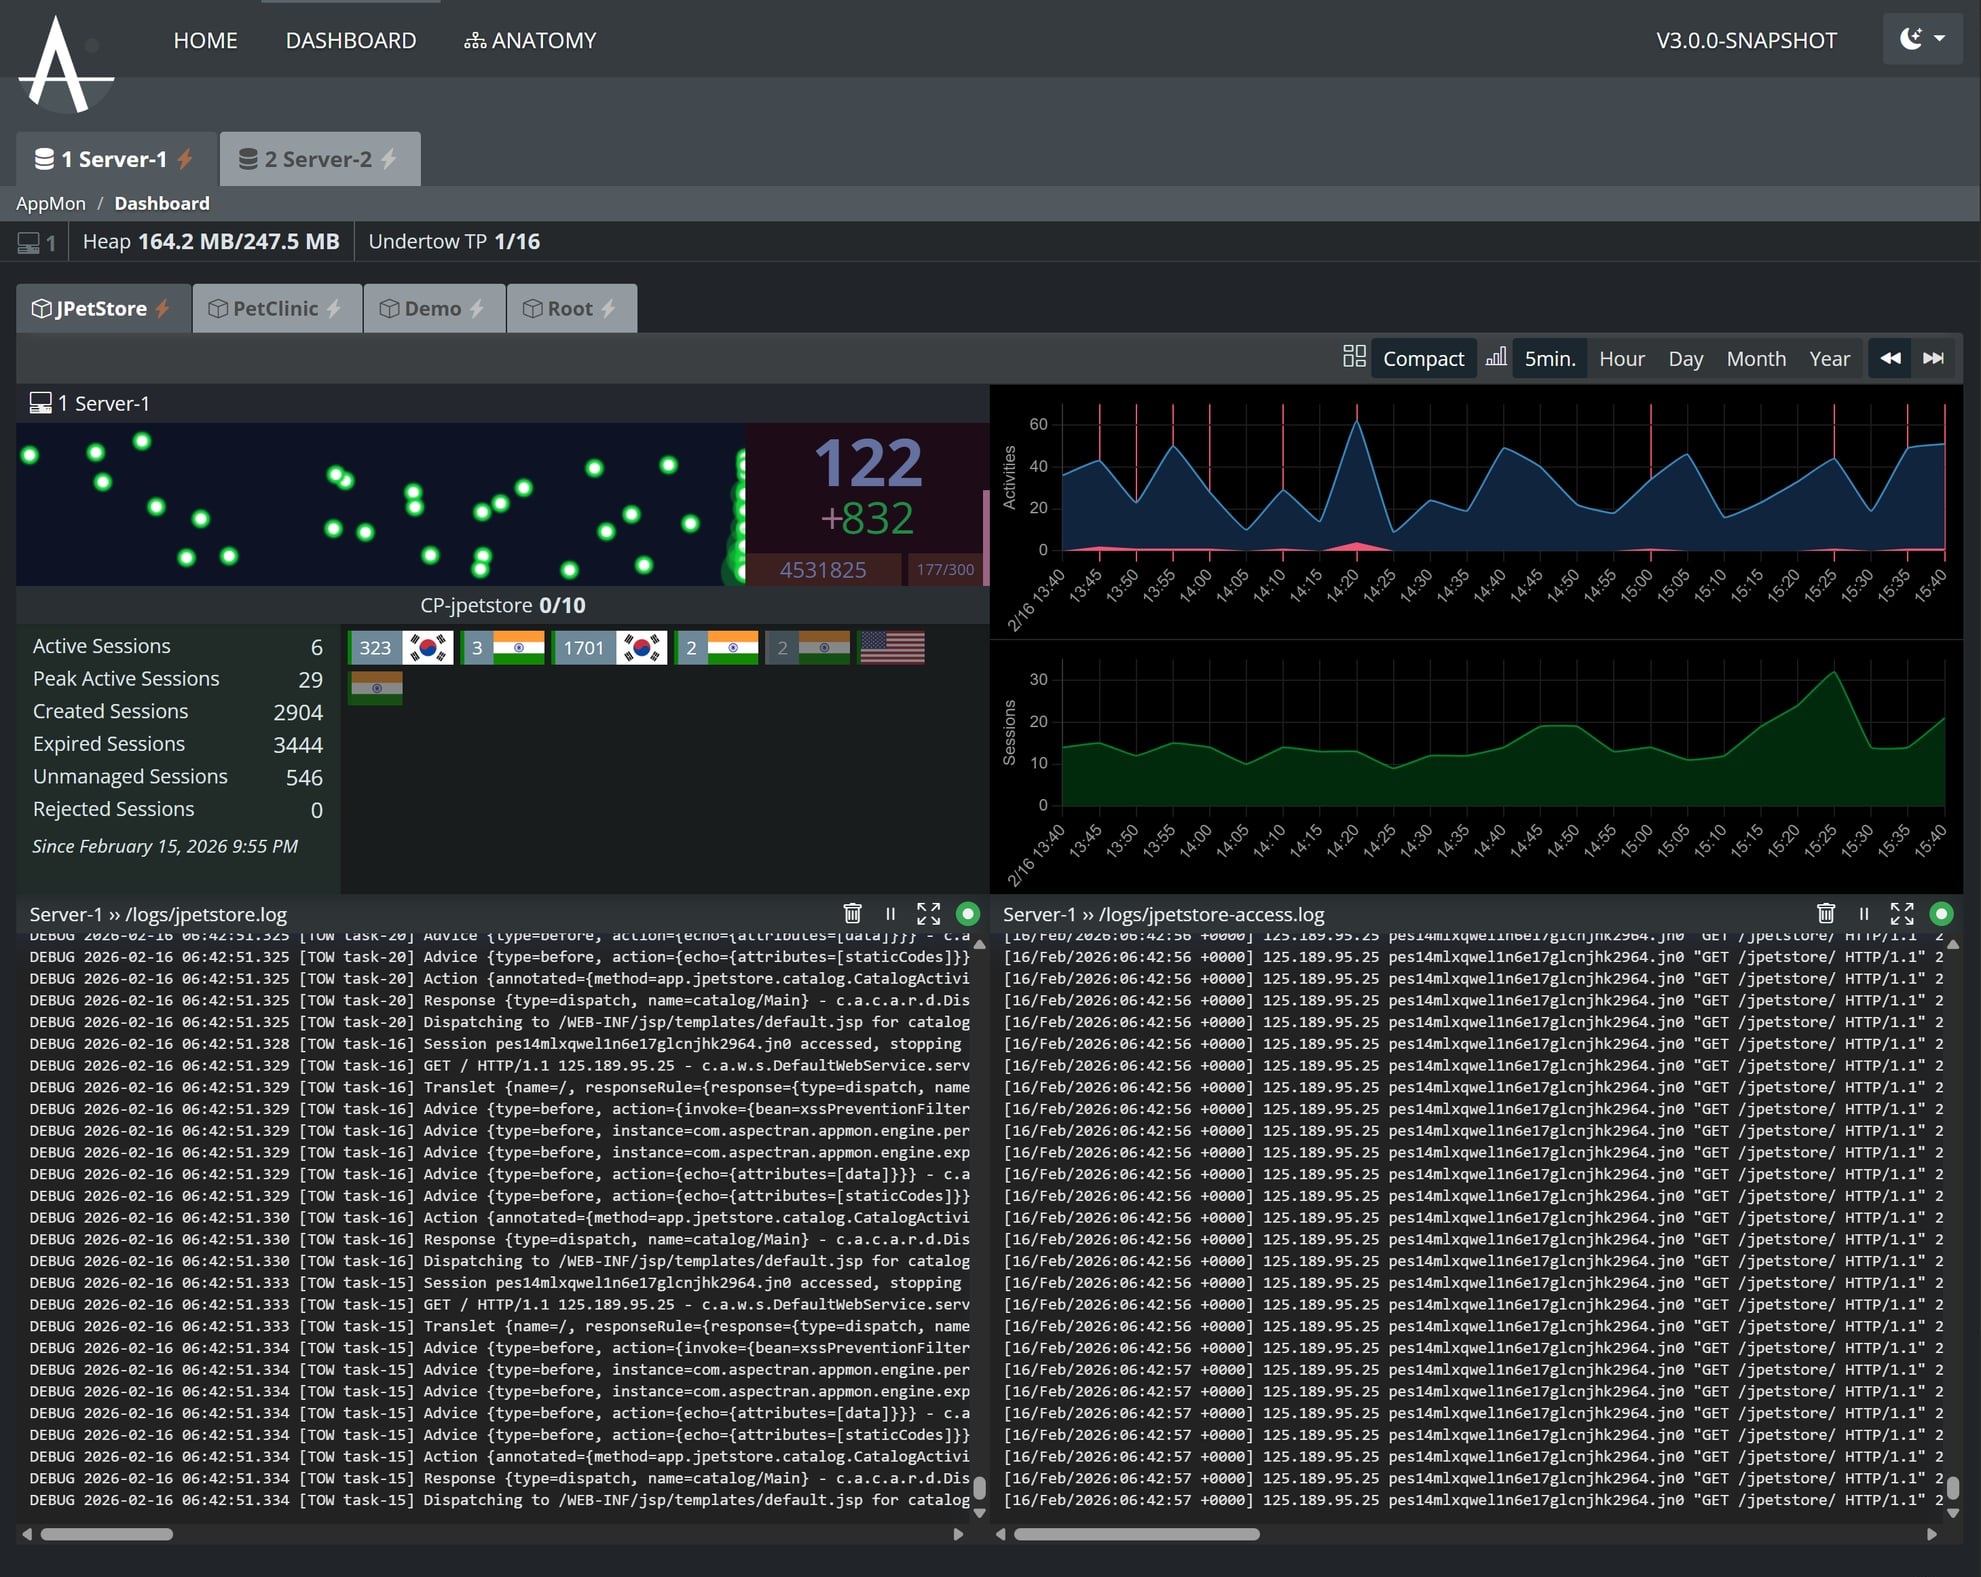
Go beyond simple metrics with the AppMon 3.0 dashboard, which represents internal system activities visually and dynamically for a more intuitive operational experience.
Dashboard Components
1. Intelligent Tab Navigation
- Domain Tabs: Logically separate and manage server groups or clusters. Indicators on each tab show connection status in real-time.
- Instance Tabs: Switch between individual application instances within a domain. Data is seamlessly synchronized during transitions, allowing you to immediately view the state of the previous instance.
2. Server Resource and Performance Monitoring
- Real-time Resource Metrics:
- Heap Status: Displays current JVM heap memory usage and maximums to detect GC status and memory leaks.
- Undertow Thread Pool: Monitors active threads against the total pool size to assess concurrent processing load.
- Activity Status (Real-time Counts): Provides three key metrics for each server instance:
- Active Activity: The number of real-time activities being processed simultaneously.
- Current Period Count: The number of activities inflowed during the current 5-minute aggregation window (displayed as a relative value like
+14). - Cumulative Total: The total number of activities accumulated since the server started (
p.cumulative).
- 5-Minute Aggregation Management: A timer (e.g.,
233/300) indicates the progress of the 300-second data aggregation. At300/300, the data is stored on the server, reflected in the analysis charts, and the cycle resets. - Summary Statistics: Periodically stored data is permanently recorded on the server, allowing users to compare and analyze historical trends and current status.
3. Canvas-based Traffic Visualization (Traffic Flow)
All user requests (Request/Activity) are visualized as ‘Bullets’ flying from left to right. It uses a high-performance Delta-time based engine to maintain smooth animation even under heavy load.
- Kinetic Visualization Logic:
- Speed vs. Response Time: As response time (
elapsedTime) increases, the bullet speed is decelerated by up to 60%. This serves as a visual indicator of system congestion. - Persistence: The time a bullet stays at the ‘finish line’ before fading is proportional to the actual server response time (
elapsedTime + 200ms). Heavier requests linger longer to draw the operator’s attention. - Hotspot & Hot Core: Requests from heavy users with an activity intensity exceeding 0.3 generate a white Hot Core at the center of the bullet for instant identification.
- Speed vs. Response Time: As response time (
- Color Coding by Status:
- Green: Normal requests processed at standard speeds.
- Yellow: Warning requests where response time starts to lag (500ms or more).
- Red: Requests that encountered an
errorduring processing.
- Data Synchronization: All activity data is aggregated in 5-minute intervals, stored on the server, and immediately reflected in the analysis charts.
4. Session State and User Activity Management
- Real-time Session List: Provides a list of session information for currently connected users.
- Country Identification: Displays country flags based on the session’s IP to understand user distribution.
- Activity Counts: Shows real-time activity counts for each session to monitor heavy users.
- Session Statistics: Summary cards for Active, Peak, and Created/Expired session flows.
5. Multi-dimensional Analysis Charts
- Activities & Sessions Chart: Visualizes trends in real-time request volume and session changes.
- Flexible Time Units: Switch between 5-minute (Default), hourly, daily, monthly, and yearly views to analyze everything from short-term spikes to long-term patterns.
6. Professional Log Console and History Exploration
A high-performance console that streams server logs in real-time.
- Real-time Tailing & Control: Supports low-latency log output with features like Pause, Clear, and Full-screen mode.
- View Previous Logs (Reverse Infinite Scroll): A ‘Load Previous Logs’ button activates when the user scrolls to the top of the log box. This allows for seamless historical context exploration while the real-time stream continues.