1. Overview & Overall Console Layout
Aspectow Console is a comprehensive visual management system integrating application monitoring, clustering, scheduling, security, and developer tools built on the Aspectran framework into a single web interface. This guide details the specific features, UI components, usage, and practical operational tips for every screen in the Console.
Console Layout Structure
- Left Sidebar: A hierarchical navigation menu organized into Management, Utilities, and Governance sections. Menu items are dynamically enabled based on user account Roles and Permissions.
- Top Header (Top Bar): Displays the current page breadcrumb path, global search, and system environment profile information.
- Bottom Right Profile & Logout: Displays the logged-in user’s nickname, account name, avatar, and logout button.
2. Home Dashboard
The central control panel rendered upon logging into the Console, helping users grasp overall system health at a glance and quickly navigate to core modules.
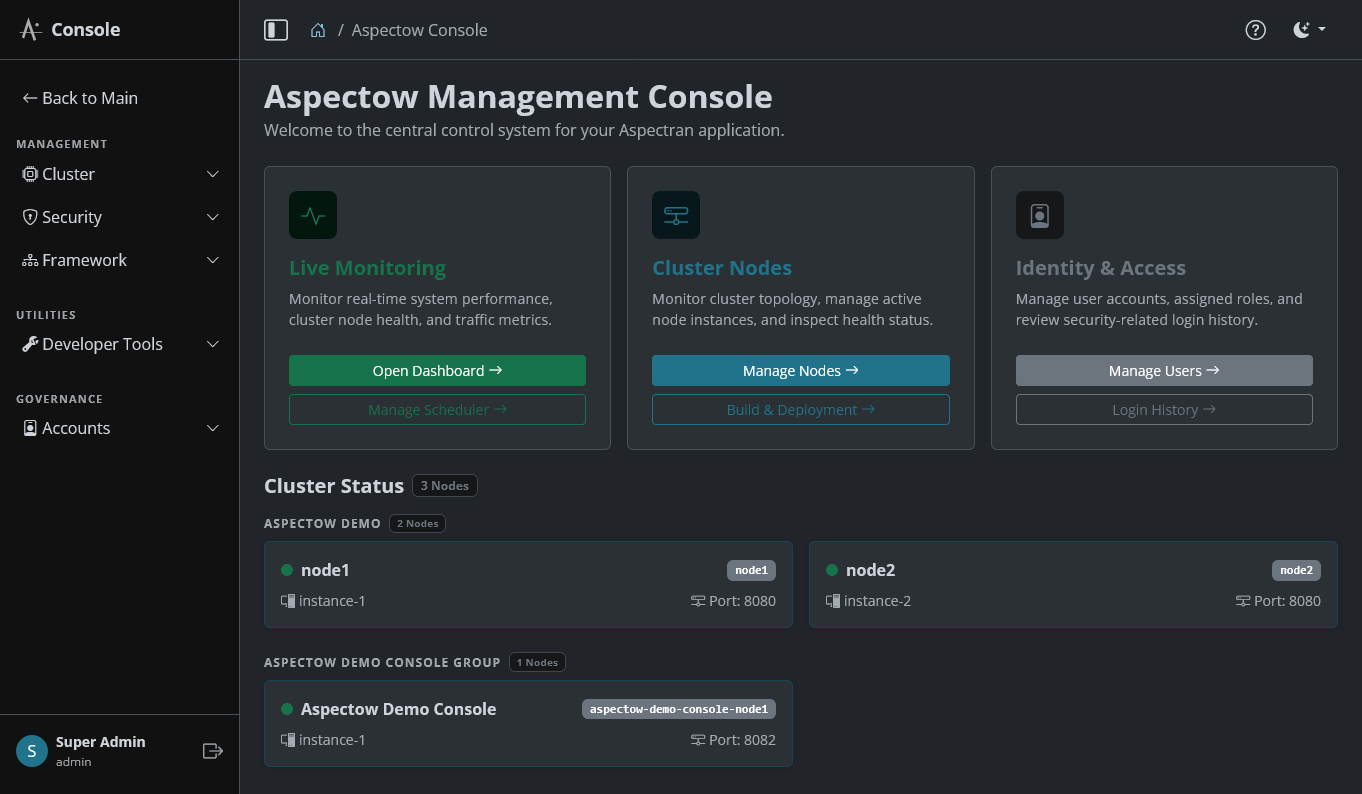
Welcome Headline & Status Indicator
The top section displays the Aspectow Management Console title alongside a welcome message for the running system, visually conveying overall operational health status.
Core Module Shortcut Cards
- Live Monitoring Card: Navigates directly to real-time traffic, JVM memory heap, thread pool, and activity monitoring (
Aspectow AppMon). - Cluster Operations Card: Navigates to cluster node status inspection, remote command execution, and scheduler management.
- Security & Vault Card: Navigates to PBE encryption token management and system encryption configuration.
- Developer Tools Card: Navigates to runtime developer utilities (AsEL Tester, Wildcard Validator, APON Converter).
3. Cluster Operations
A suite of screens for central control of server instances and distributed scheduling tasks operating in a cluster environment.
3.1. Cluster Nodes
Monitors the real-time health of all active nodes in the cluster and dispatches bulk control commands.
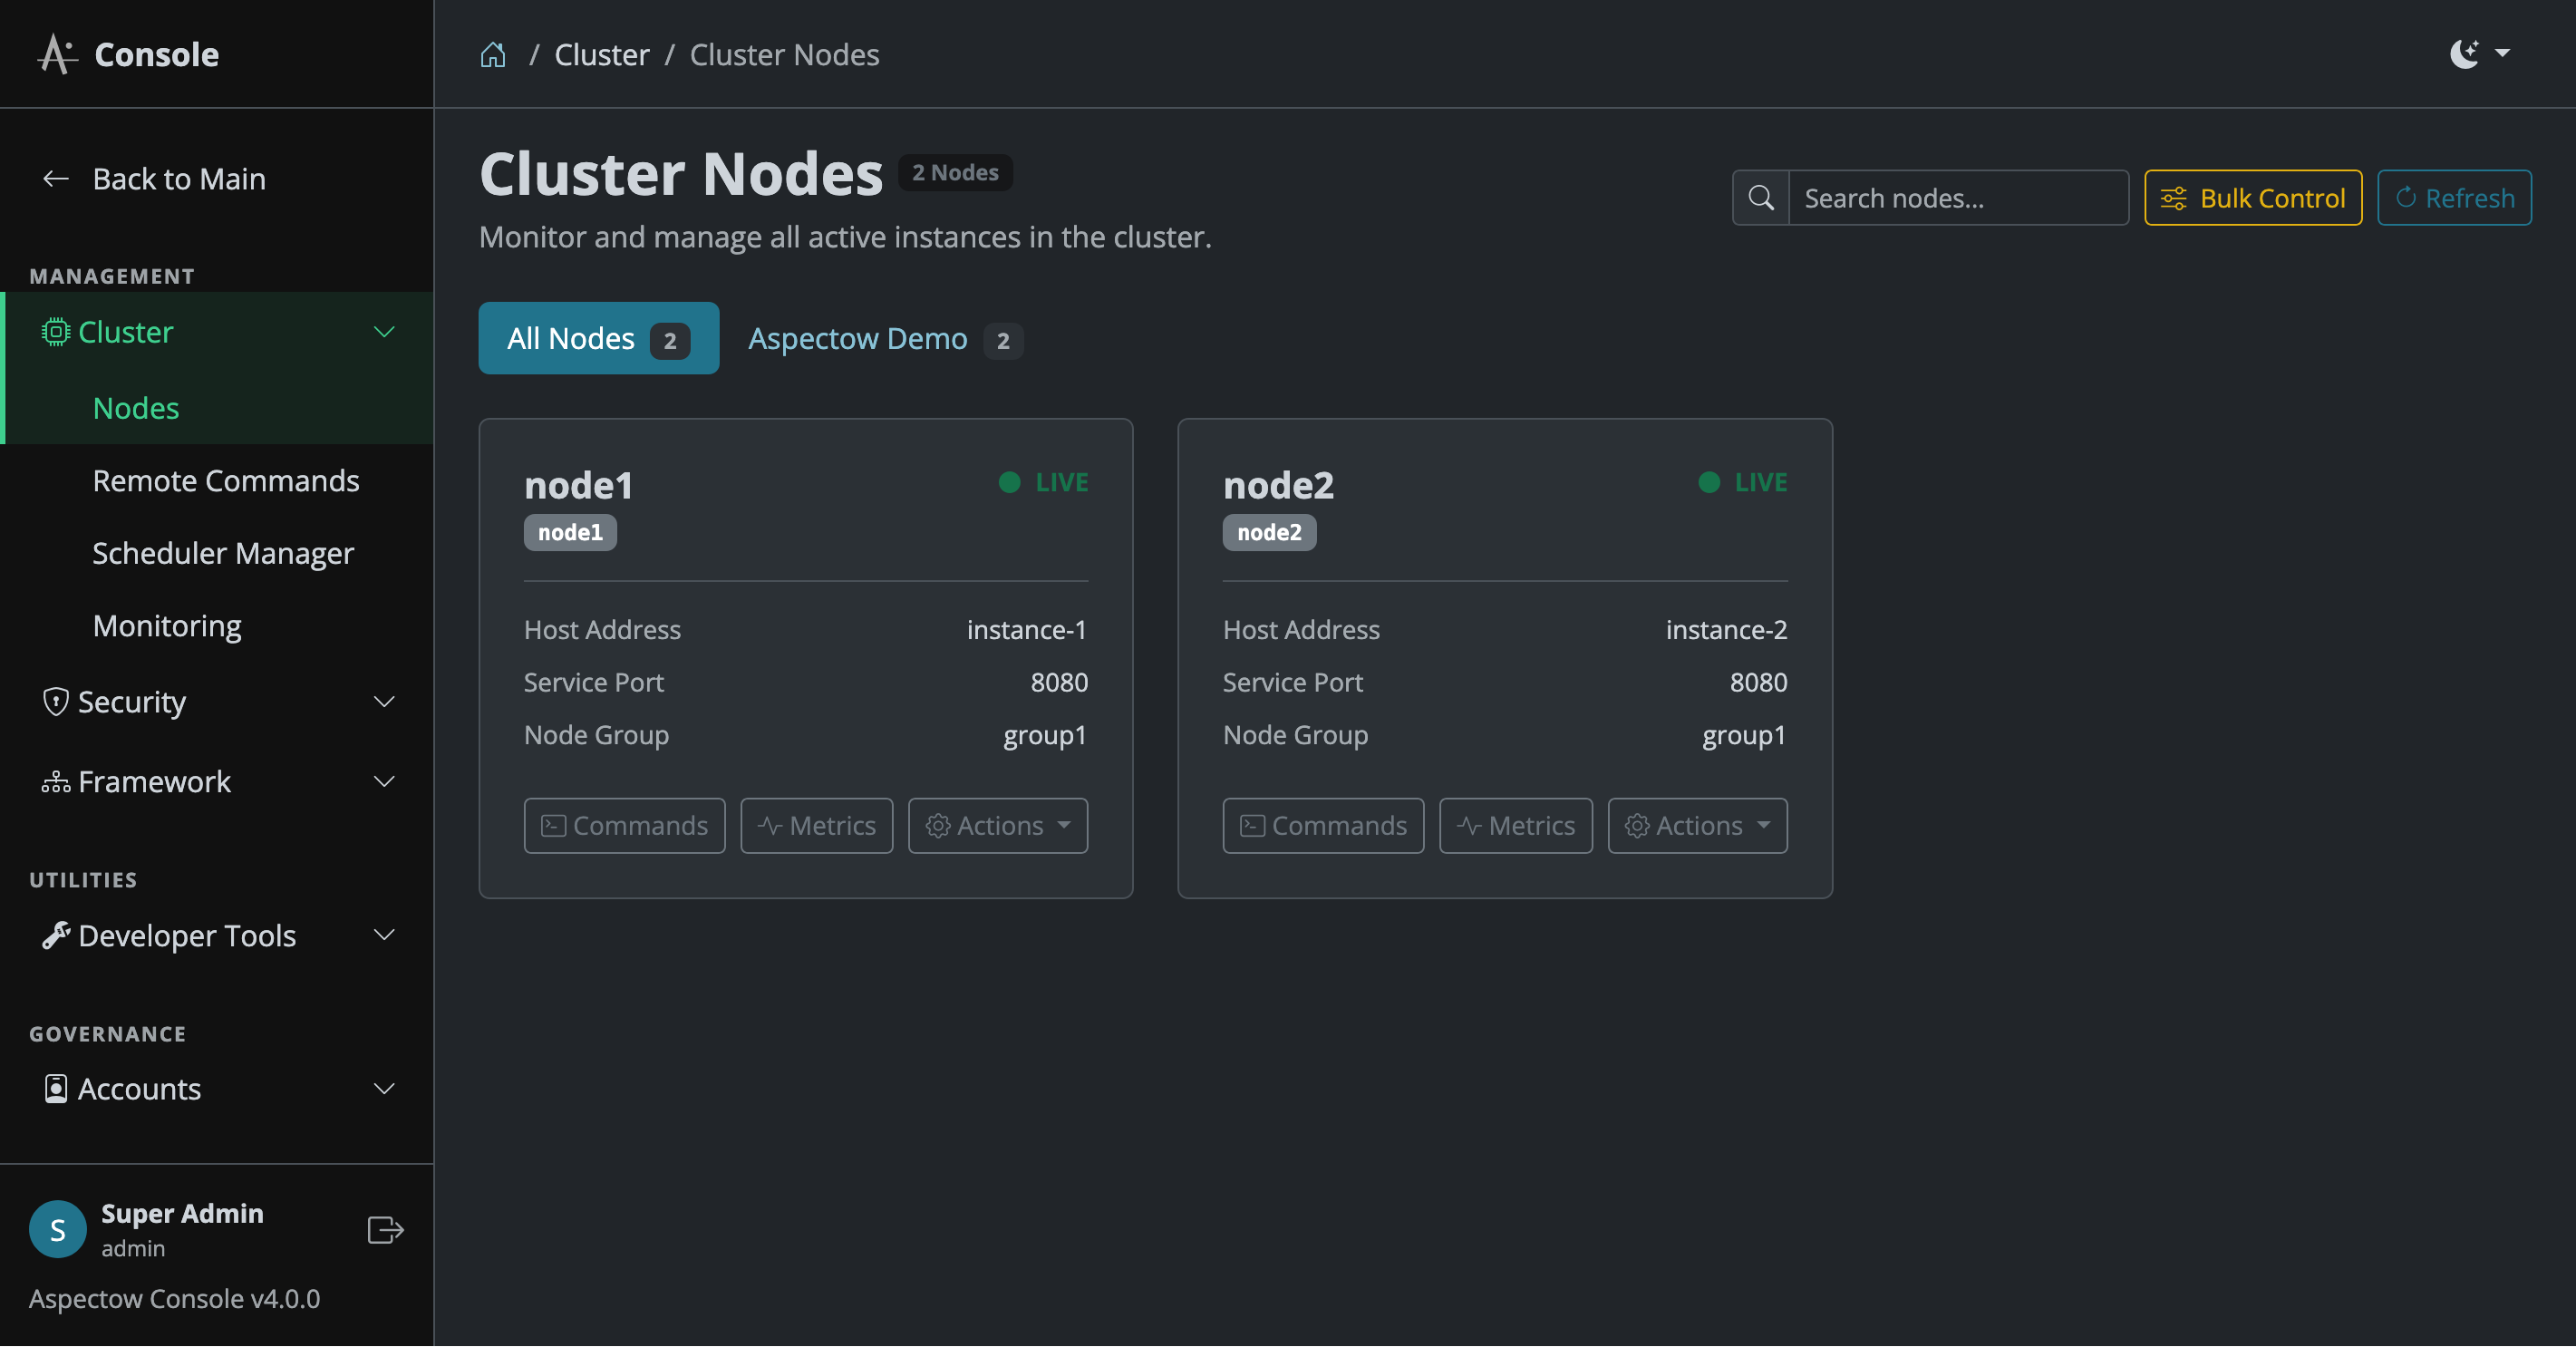
Top Control Bar
- Total Node Count Badge: Displays the total number of connected cluster nodes in real time (e.g.,
0 Nodes). - Node Search Field: Filters nodes instantly by entering node title, IP address, or node ID.
- Bulk Control Button: Available to administrators with
NODE_MANAGE,SUPER_ADMIN, orDEMOpermissions, invoking the bulk control modal. - Refresh Button: Re-queries node statuses to update the screen upon clicking.
Cluster Group Tabs
In Gateway cluster mode, tabs are automatically generated for each server group. The All Nodes tab displays all nodes, while group-specific tabs isolate nodes belonging to a particular server group. Badge counters beside each tab display node counts.
Node Information Cards
Each node is rendered as an independent card providing the following metrics and action triggers:
- Node Title & ID Badge: Node title and unique node ID rendered in monospace font.
- Status Dot & Status Text: Clearly indicates node operational health with color-coded LED dots and text (Green
LIVE: normal running, YellowPAUSED/STOPPING: paused or shutting down, RedDEAD: disconnected/down). - Console Badge: A light blue
Consolebadge indicates that the node is running the administrative control plane. - Host Address & Service Port: Host IP address and service port number of the node.
- Node Group: Group name to which the node belongs (in Gateway cluster mode).
- Metrics Button: Opens a new popup window displaying real-time AppMon metrics for the selected node.
- Commands Button: Navigates directly to the Remote Command Center with the target node automatically pre-selected.
- Actions Dropdown Menu:
- Pause Node (Visible when
LIVE): Temporarily pauses transaction reception and execution on the node. - Resume Node (Visible when
PAUSED): Restores a paused node back to normal operational state. - Restart Service (Hot): Gracefully recreates the
ActivityContextand reloads application bean rules and classes without stopping the JVM process. - Restart Server (Cold): Completely terminates the OS daemon/service process and reboots the JVM instance. Automatically tracks recovery via background health check polling (
/cluster/build/health/{nodeId}) until the node returns toLIVEstatus. - Audit Trail: Directly opens the build and deployment audit trail popup window (
cluster/build/audit/?nodeId=...) for the selected node (requires build permissions).
- Pause Node (Visible when
Bulk Control Modal
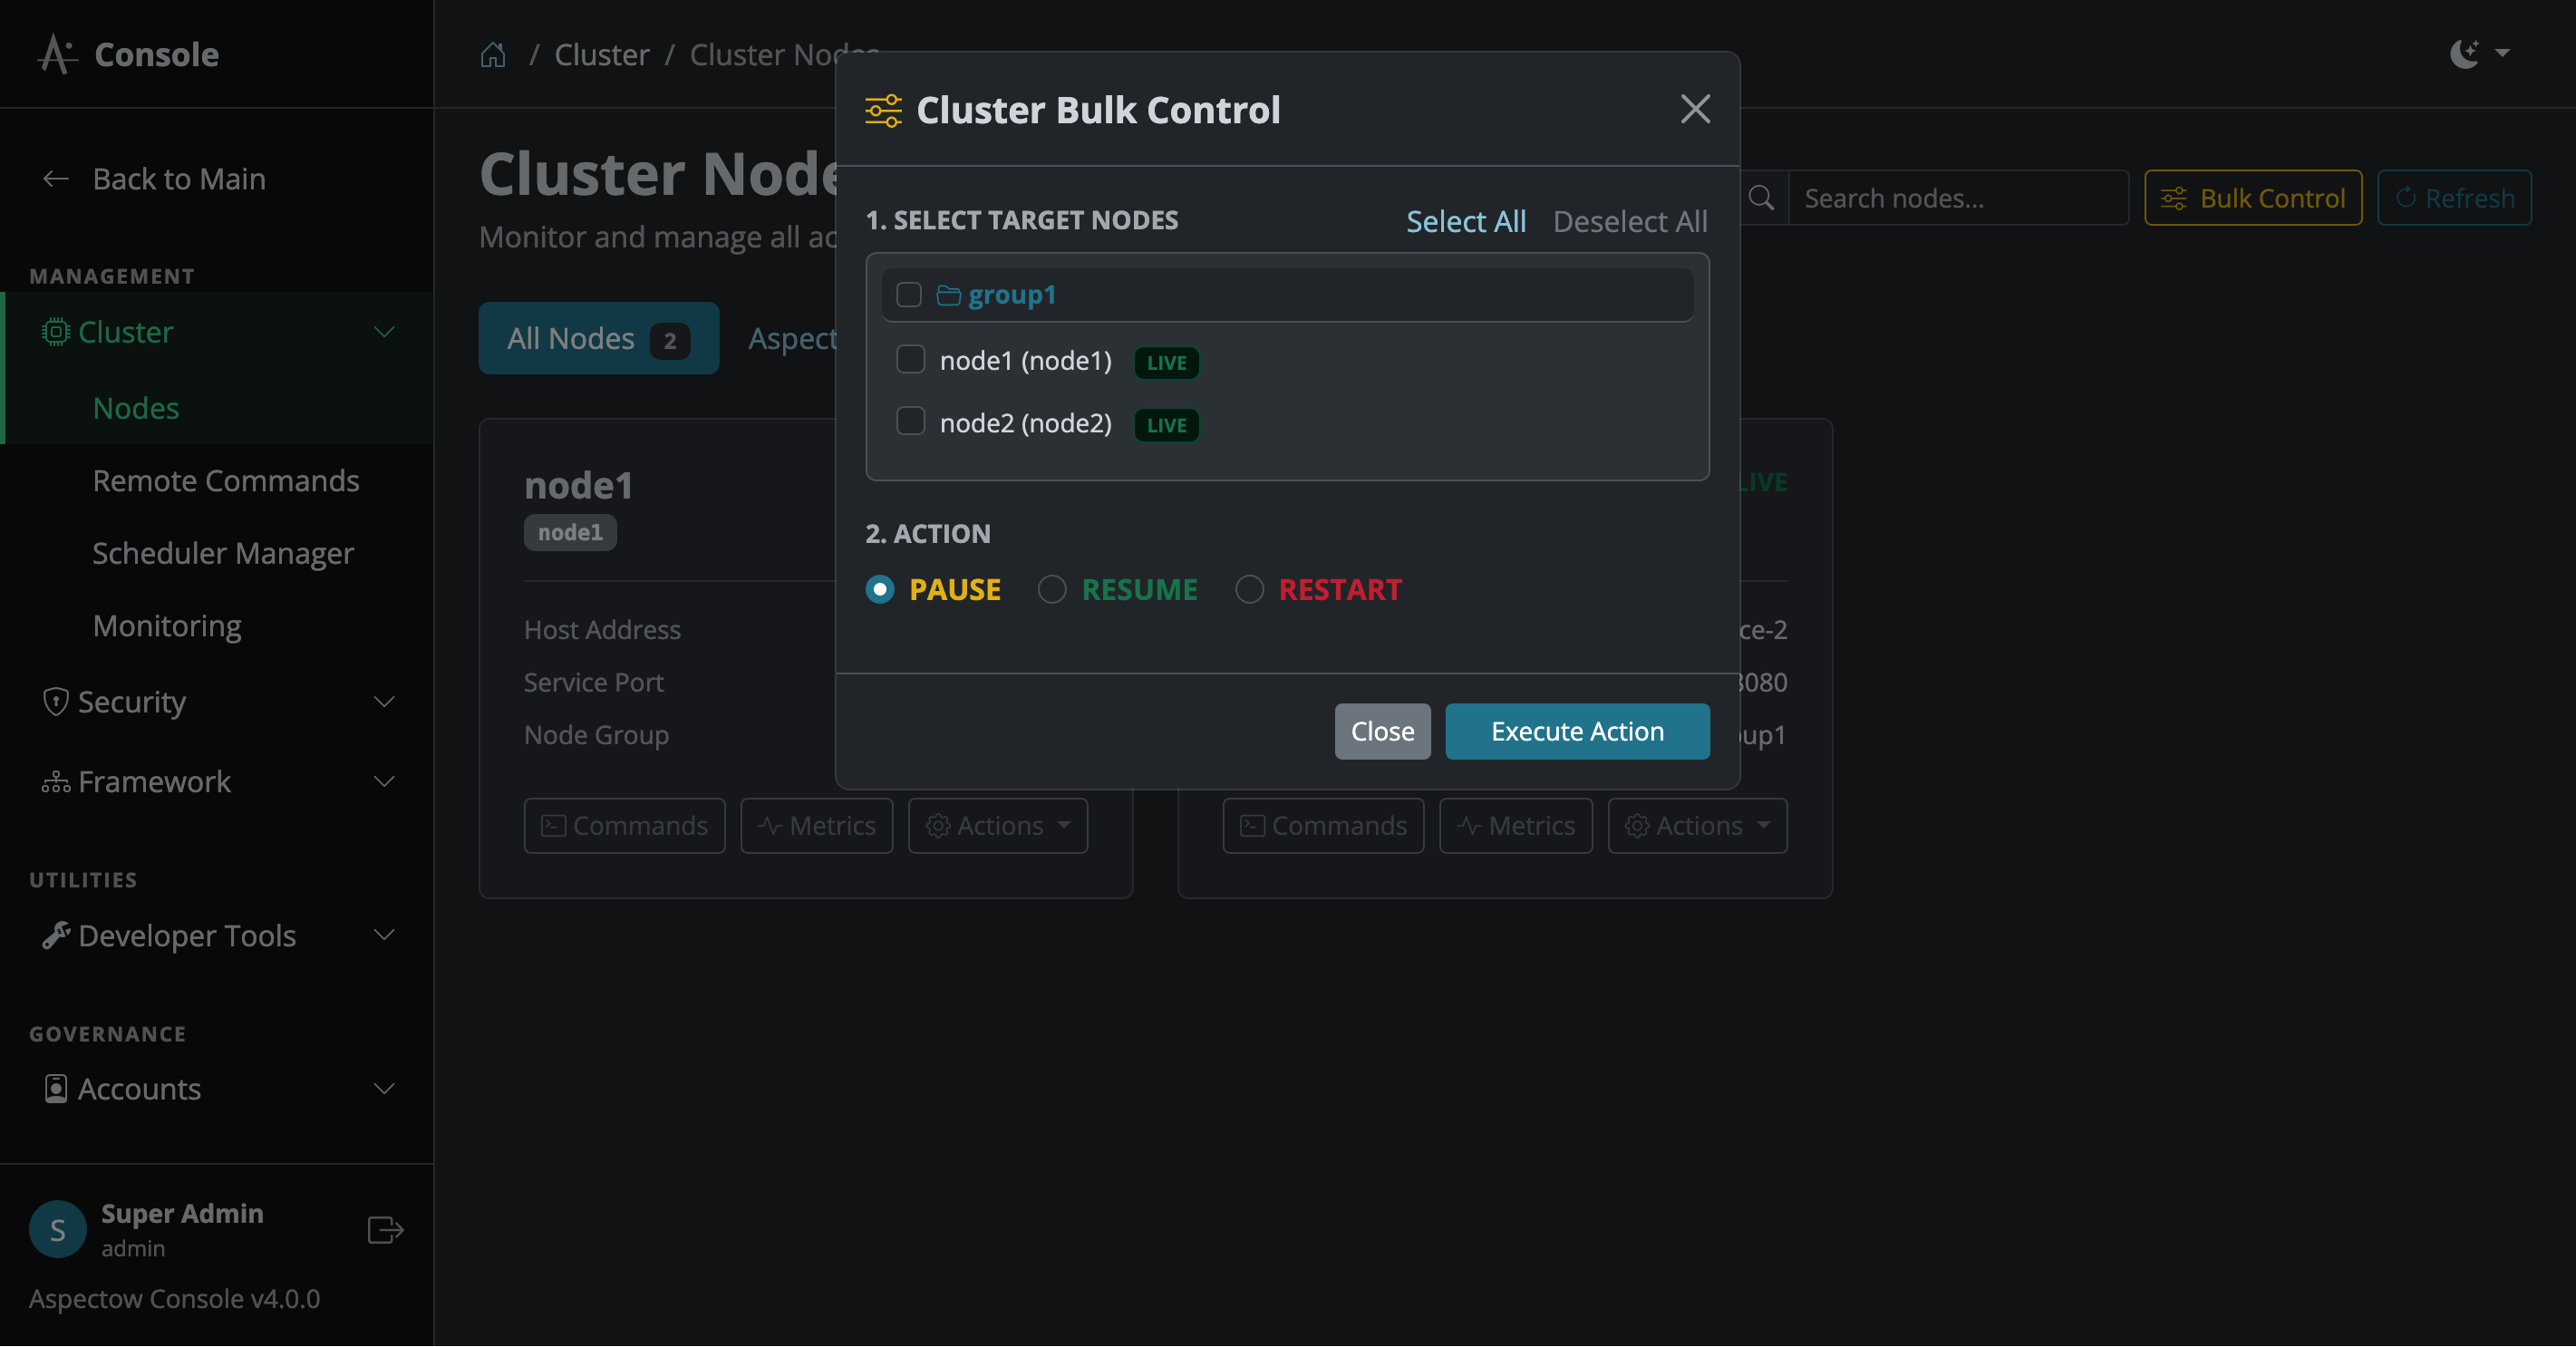
Allows administrators to select multiple nodes and dispatch bulk control commands with a single click:
- 1. Select Target Nodes:
- Easily multi-select or deselect all cluster nodes or specific group checkboxes via
Select All/Deselect Allbuttons. - Exclude Console Checkbox: Automatically excludes console gateway nodes from bulk operations to prevent administrative disruption.
- Hierarchical Group Checkboxes: Quickly select all worker nodes within a specific server group.
- Easily multi-select or deselect all cluster nodes or specific group checkboxes via
- 2. Action Selection (4 Core Action Cards):
- PAUSE (Pause): Temporarily stops incoming traffic and pauses background activity on selected nodes (console node automatically excluded).
- RESUME (Resume): Restores paused nodes back to normal active state to resume traffic reception.
- RESTART SERVICE (Hot): Recreates
ActivityContextwithout shutting down the JVM to hot-apply configuration updates. - RESTART SERVER (Cold): Completely reboots OS daemon processes across target nodes, tracking node recovery via automated health checks.
3.2. Build & Deployment
An interactive module for orchestrating asynchronous remote Git source updates, Maven compilation, configuration/web application deployment, and real-time live terminal streaming across cluster nodes.
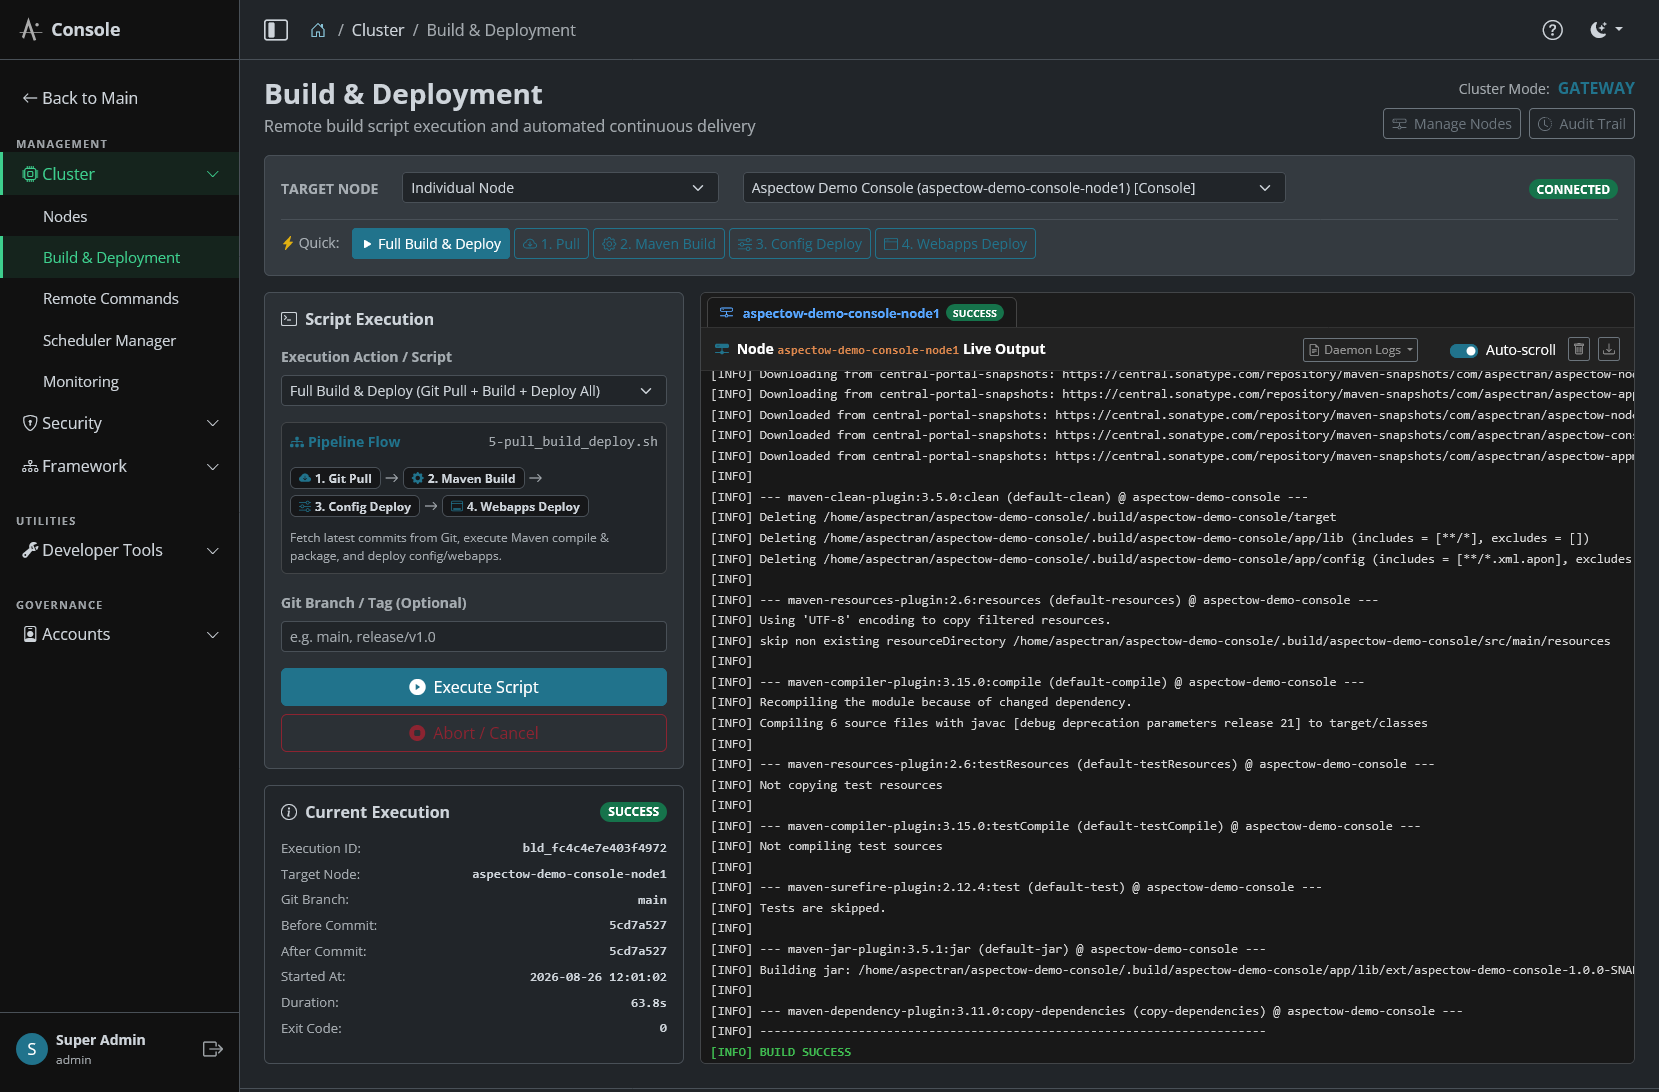
Top Control Bar
- Target Selector:
All Service Nodes(Default): Targets all business service nodes in the cluster, excluding console nodes.All Nodes in Cluster: Targets all active cluster nodes including console nodes.Specific Group: Targets a specified server group (e.g.,api-group,batch-group).Individual Node: Targets a single specified node.
- Manage Nodes Button: Opens the cluster nodes management popup window (
cluster/nodes/popup/). - Audit Trail Button: Opens the Build & Deployment Audit Trail popup window (
cluster/build/audit/) to inspect and export historical execution records. - Quick Action Bar:
- One-click shortcut buttons to instantly trigger common deployment scripts (
Full Build & Deploy,1. Pull,2. Maven Build,3. Config Deploy,4. Webapps Deploy).
- One-click shortcut buttons to instantly trigger common deployment scripts (
Left Control & Metadata Panel
- Script Selector:
- Standard Deploy: Full Build & Deploy (
5-pull_build_deploy.sh), Fast Deploy without rebuild (6-pull_deploy.sh). - Single Step: Git Pull Only (
1-pull.sh), Maven Build Only (2-build.sh), Config Deploy Only (3-deploy_config.sh), Webapps Deploy Only (4-deploy_webapps.sh). - Selective Deploy: Pull & Deploy Config Only (
7-pull_deploy_config_only.sh), Pull & Deploy Webapps Only (8-pull_deploy_webapps_only.sh), Pull & Deploy Config + Webapps (9-pull_deploy_config_webapps_only.sh).
- Standard Deploy: Full Build & Deploy (
- Pipeline Flow Preview: Displays a visual badge workflow of the selected script’s stages (e.g.,
Git Pull→Maven Build→Config Deploy→Webapps Deploy). - Git Branch / Tag (Optional): Specifies a target Git branch (e.g.,
main,release/v2.0), release tag (e.g.,v1.2.0), or commit SHA. Defaults to the latest commit on the active branch if omitted. - Execution & Abort Buttons:
Execute Scriptstarts asynchronous execution, whileAbort / Cancelsends an immediate cancellation signal to target nodes. - Current Execution:
- Individual Node View: Displays Execution ID, Target Node, Git Branch, Before/After Commit Hashes, Start Timestamp, Real-time Duration ticker, and Exit Code.
- All Nodes View: Displays a compact summary card list comparing execution statuses and durations across all participating nodes.
Right Real-Time Terminal Panel
- Dynamic Node Tabs Bar:
- Constructs an
All Nodesconsolidated tab alongside dedicated tabs for each target node (node1,node2, etc.), displaying live execution status badges (RUNNING,SUCCESS,FAILED).
- Constructs an
- Terminal Header Tools:
- Daemon Logs Dropdown: Fetches the latest 200 lines of
daemon-stderr.logordaemon-stdout.logfrom target nodes directly into the terminal to diagnose startup issues. - Auto-scroll Toggle: Controls automatic downward scrolling as new log lines stream in.
- Clear Terminal: Clears current terminal output.
- Download Logs: Exports verbatim terminal output text to a
.logfile on the local machine.
- Daemon Logs Dropdown: Fetches the latest 200 lines of
- ANSI Color Terminal: Real-time ANSI escape code parser rendering success (green), errors (red), warnings (yellow), and information (blue) in a dark-themed live stream console.
Build & Deployment Audit Trail Modal
Clicking the Audit Trail button opens a dedicated compliance audit popup window (cluster/build/audit/).
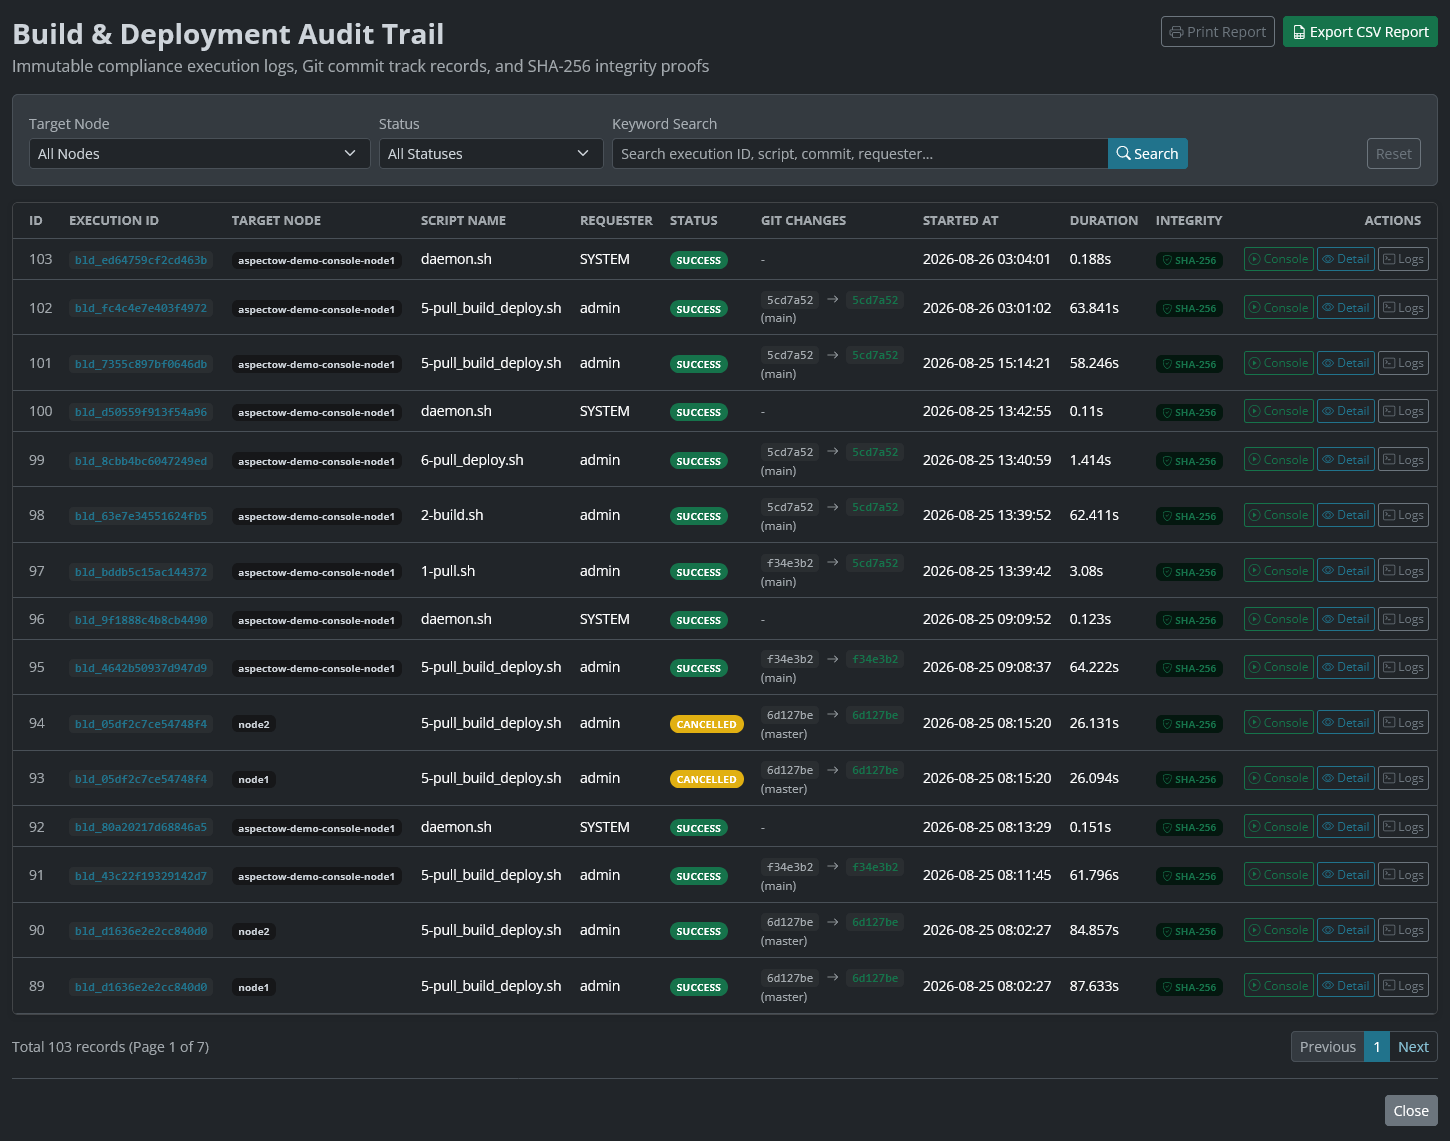
- Header Toolbar:
- Go to Build Console: Transitions directly into the live Build Console with the execution context restored.
- Print Report: Optimizes the audit report for high-contrast paper printing, hiding navigation elements automatically.
- Export CSV Report: Exports filtered audit records into a spreadsheet-compatible CSV file for compliance reporting.
- Filter Panel:
- Filters records by Target Node, Status (
SUCCESS,FAILED,RUNNING,CANCELLED), and full-text Keyword Search (Execution ID, script name, commit hash, requester username).
- Filters records by Target Node, Status (
- Audit Table:
- Displays Execution ID, target node, script name, requester, status badge, Git commit changes (Before → After commit hashes and branch), start time, duration, and SHA-256 integrity verification badge.
- Audit Verification Report Modal (
DetailButton):- Integrity Check Banner: Validates the cryptographic SHA-256 digest against stored logs, displaying a green
Cryptographically Valid & Untamperedbadge. - Detailed Attributes: Presents Execution ID, target node, script, requester, status, exit code, start/finish timestamps, duration, Git branch, commit changes, commit message, SHA-256 digest, and full error summary if failed.
- Integrity Check Banner: Validates the cryptographic SHA-256 digest against stored logs, displaying a green
- Console Output Stream Modal (
LogsButton):- Reconstructs the full verbatim terminal output from RDBMS storage with ANSI color rendering.
- Download Full Log Button: Exports raw log text for offline debugging and long-term archiving.
In-Depth Guide: For detailed remote deployment architecture, process-independent safe restarts (
DetachedRestartRunner), multi-node build locking, and operational best practices, refer to the Aspectow Console Build & Deployment Guide.
3.3. Remote Commands
An interactive Command Center for dispatching interactive CLI/Shell commands to target cluster nodes and inspecting results in real time.
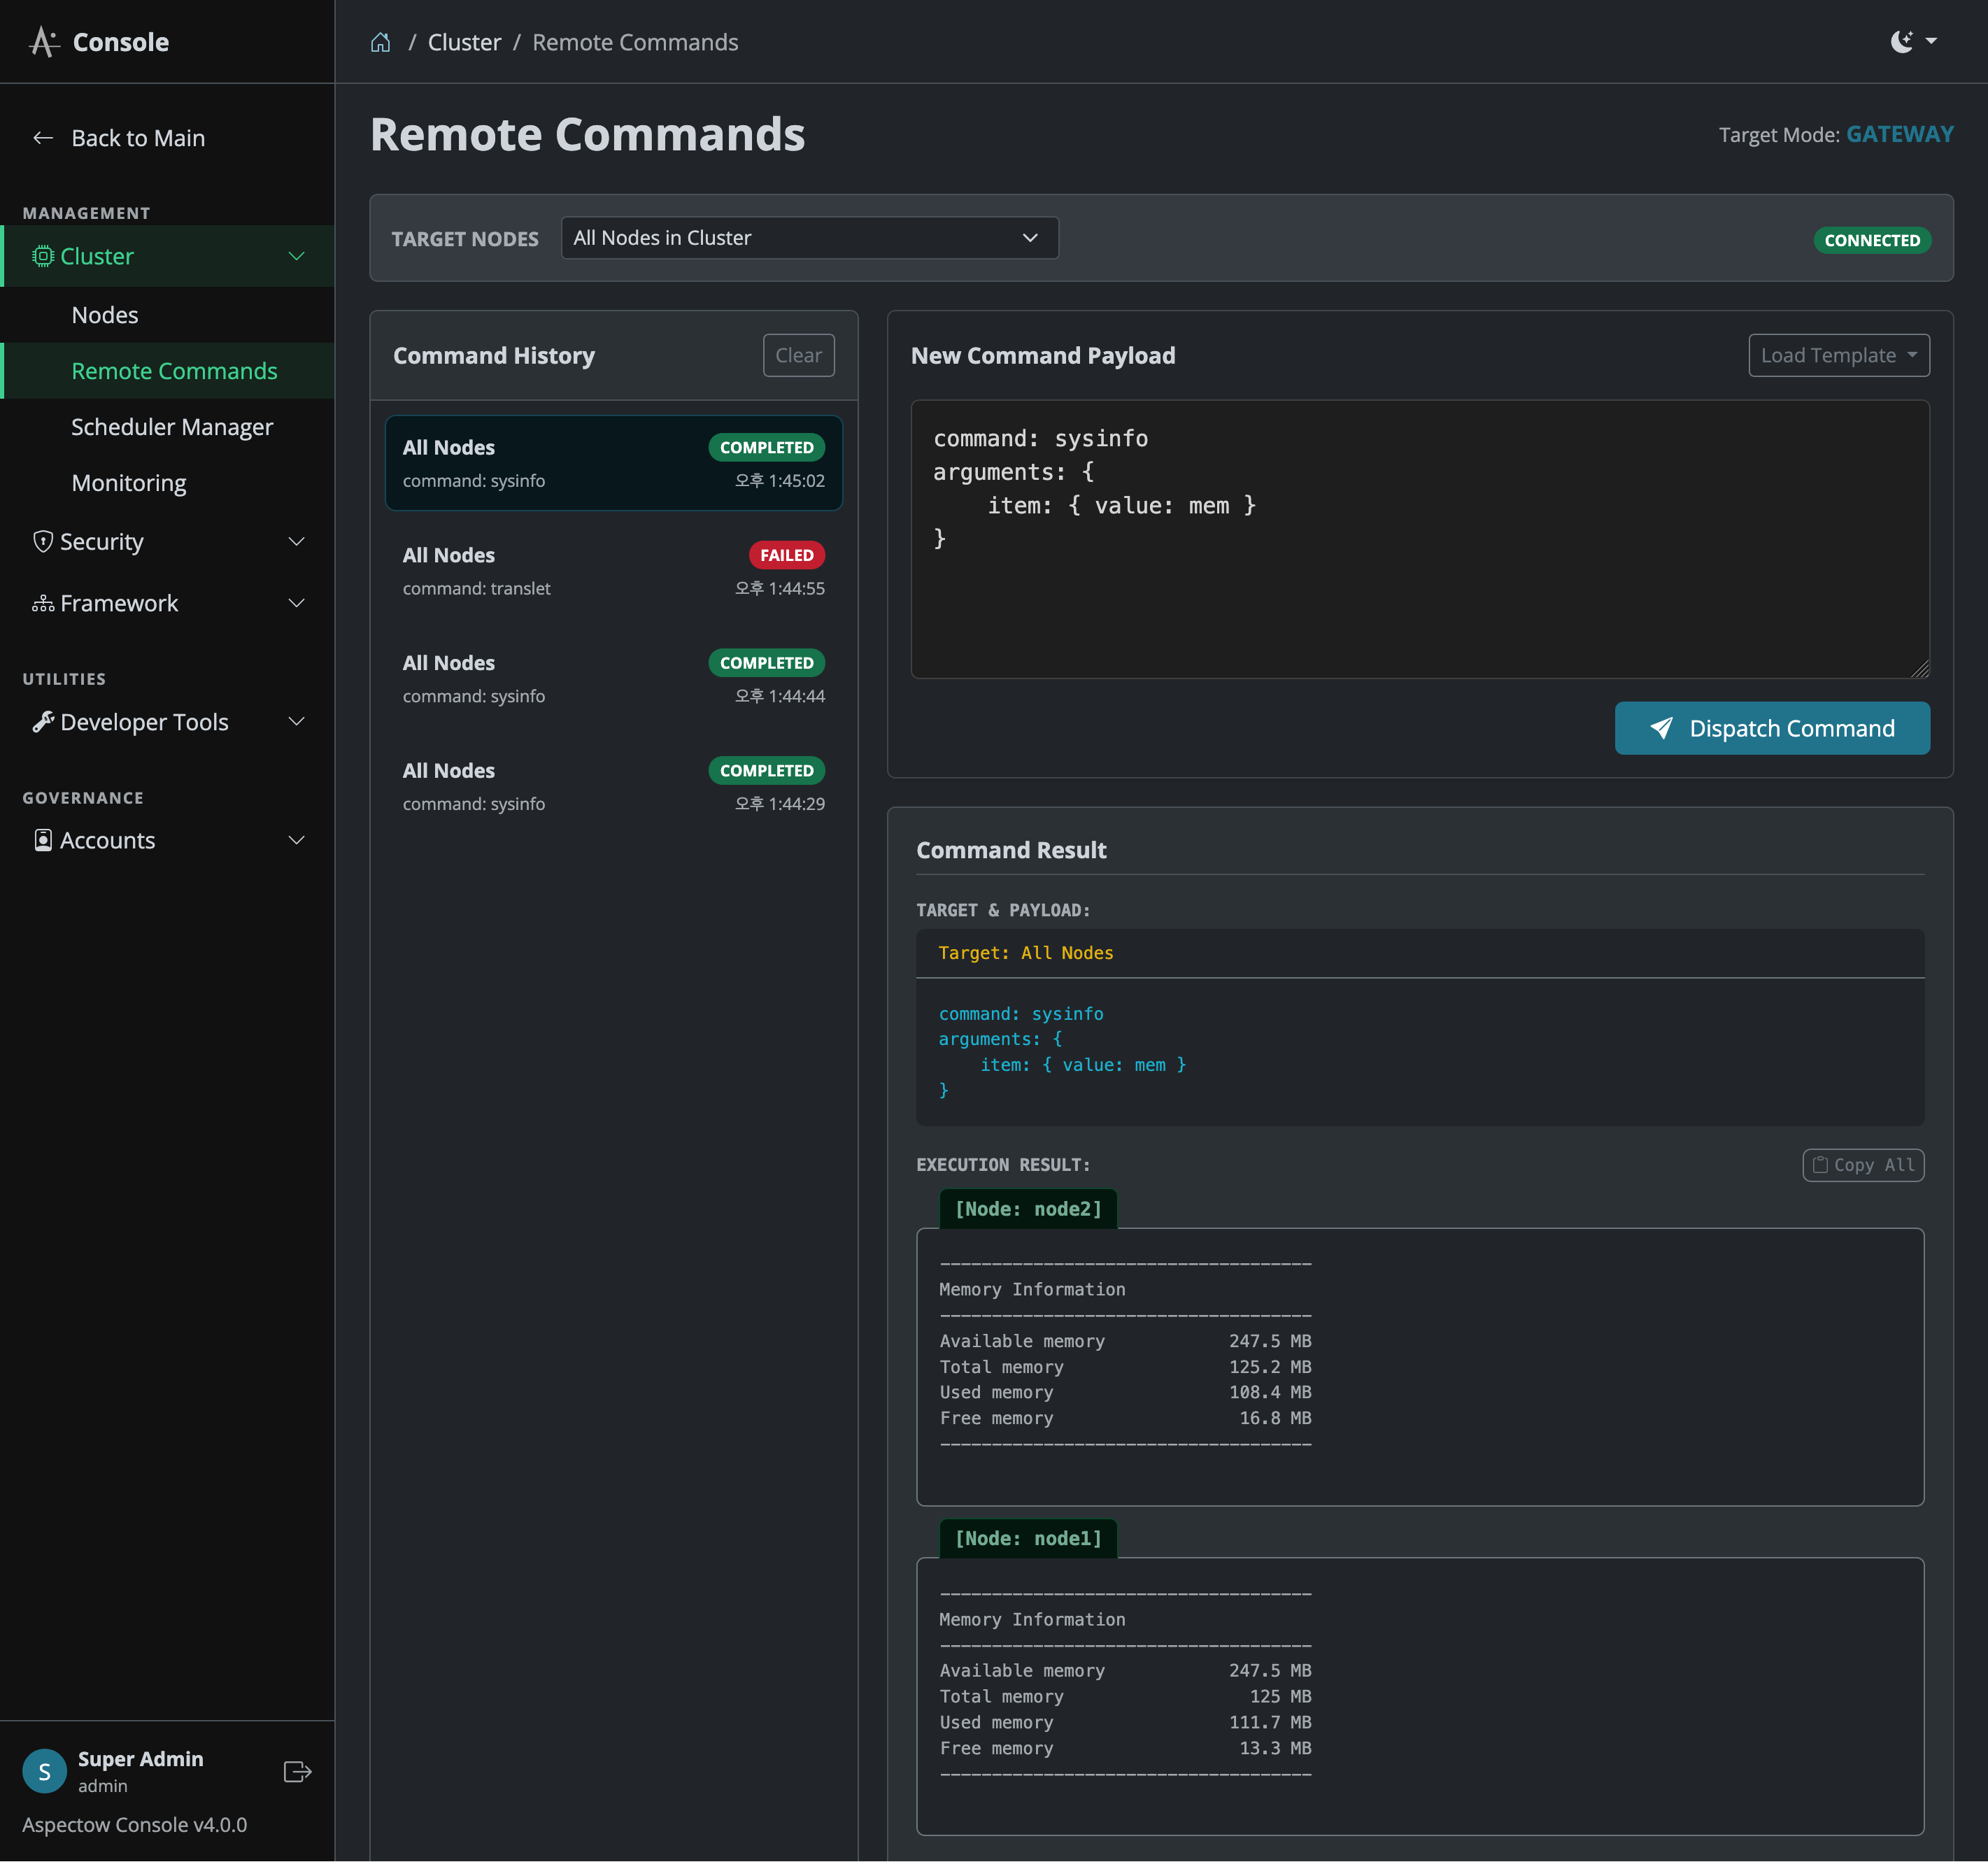
Screen Layout
Divided into a 350px left History Panel and a right panel containing the Target Selector, Command Editor, and Console Output.
Target Selector
Selects execution targets. Choosing All Active Nodes executes commands across all cluster nodes simultaneously, while choosing a specific node limits execution to that single target.
Command Editor
An input window for writing shell commands or Aspectran admin commands, supporting multi-line scripts. Clicking Execute dispatches the command via the asynchronous command bus.
Console Output
Streams execution results in real time separated by node tabs.
- Standard Output: Standard execution output rendered in clear light text.
- Standard Error: Execution failures or error messages highlighted in red text.
History Panel
Stores past command executions with timestamps, target node names, success/failure badges, and command previews. Clicking an entry restores the command and target settings into the editor for instant re-execution.
3.4. Scheduler Manager
Monitors and controls Aspectran Scheduler services and distributed jobs registered in a cluster environment. Supports two view modes via top view controls: Dashboard View for a cluster-wide overview and Detail View for node-specific job management.
Dashboard View
Displays overall scheduler operational health and aggregated logs across all cluster nodes.
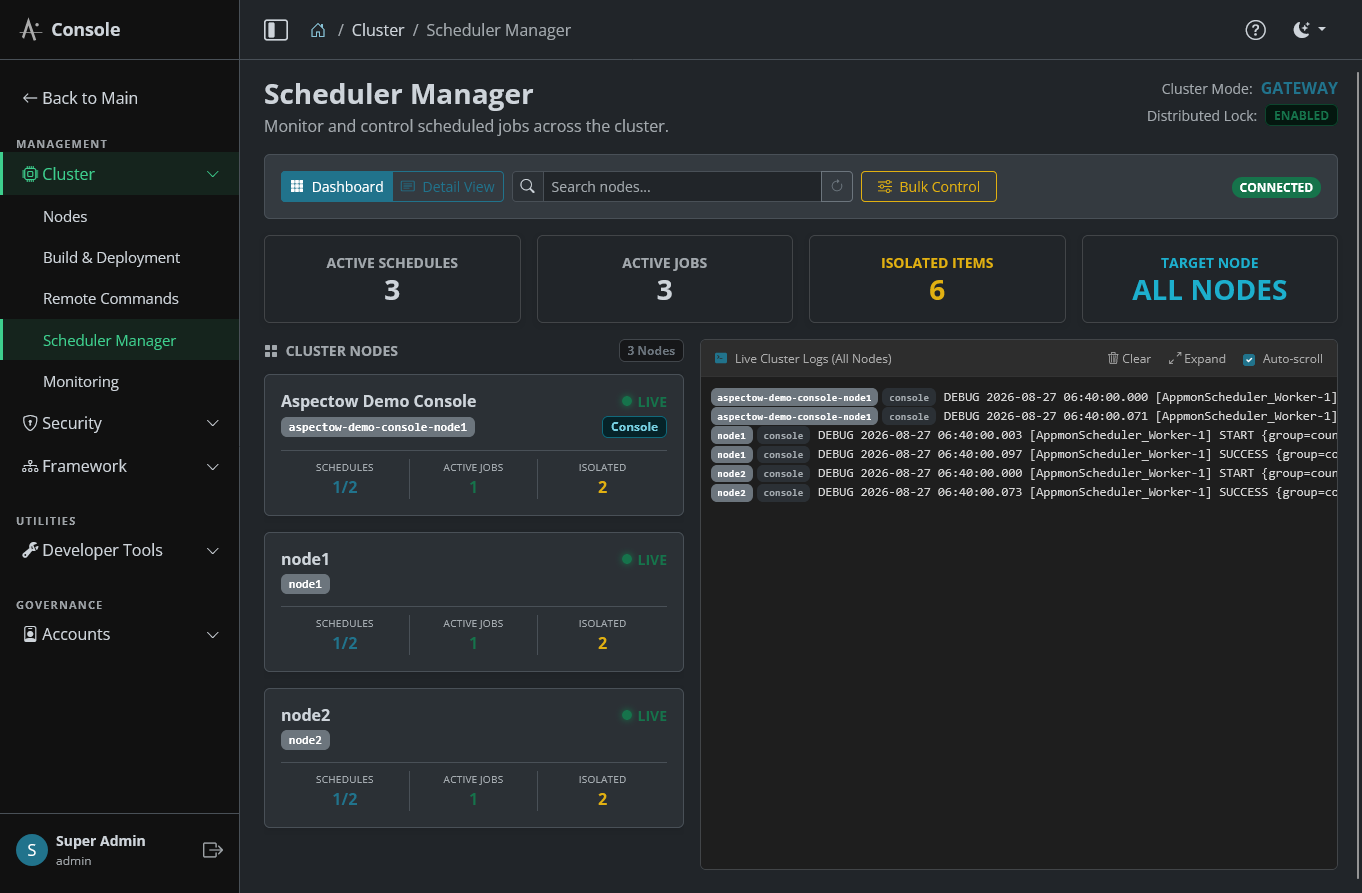
- Summary Section: Displays counters for Active Schedules, Active Jobs, Isolated Items, and Target Node metrics at a glance.
- Node Card Grid: Renders each cluster node as a grid card displaying node title, group, health status (Live/Dead/Connecting LED indicator), and active schedule/job counts. Clicking a card transitions with a pulsing animation directly to that node’s Detail View.
- Cluster Integrated Log Console: A dark-themed console box located at the bottom of the screen, where scheduler start, stop, trigger execution, and error logs across all nodes are collected and streamed in real time. Supports Pause, Clear, and Full-screen expansion.
Detail View
Monitors specific scheduler services and dynamically controls individual jobs for a selected node via the node selector.

- Scheduler Service Card: Displays registered scheduler service names, total job counts, active cron counts, and Running/Paused status badges for the selected node.
- Isolated Mode Indicator: Indicates whether a job is isolated to a specific node or shared via distributed locks using a yellow warning icon.
- Job Table: Lists job names, Trigger Type (Cron vs Simple Interval), Cron expressions (e.g.,
0 0/5 * * * ?- runs every 5 minutes), Next Fire Time, Last Fire Time, and status pills. - Job Control Buttons:
Pause/Resume: Temporarily pauses or resumes automatic execution for a specific job.Job Details: Opens a modal displaying detailed job parameters and execution history.
- Node-Specific Log Console: Filters and streams scheduler logs exclusively for the selected node.
Scheduler Bulk Control Modal
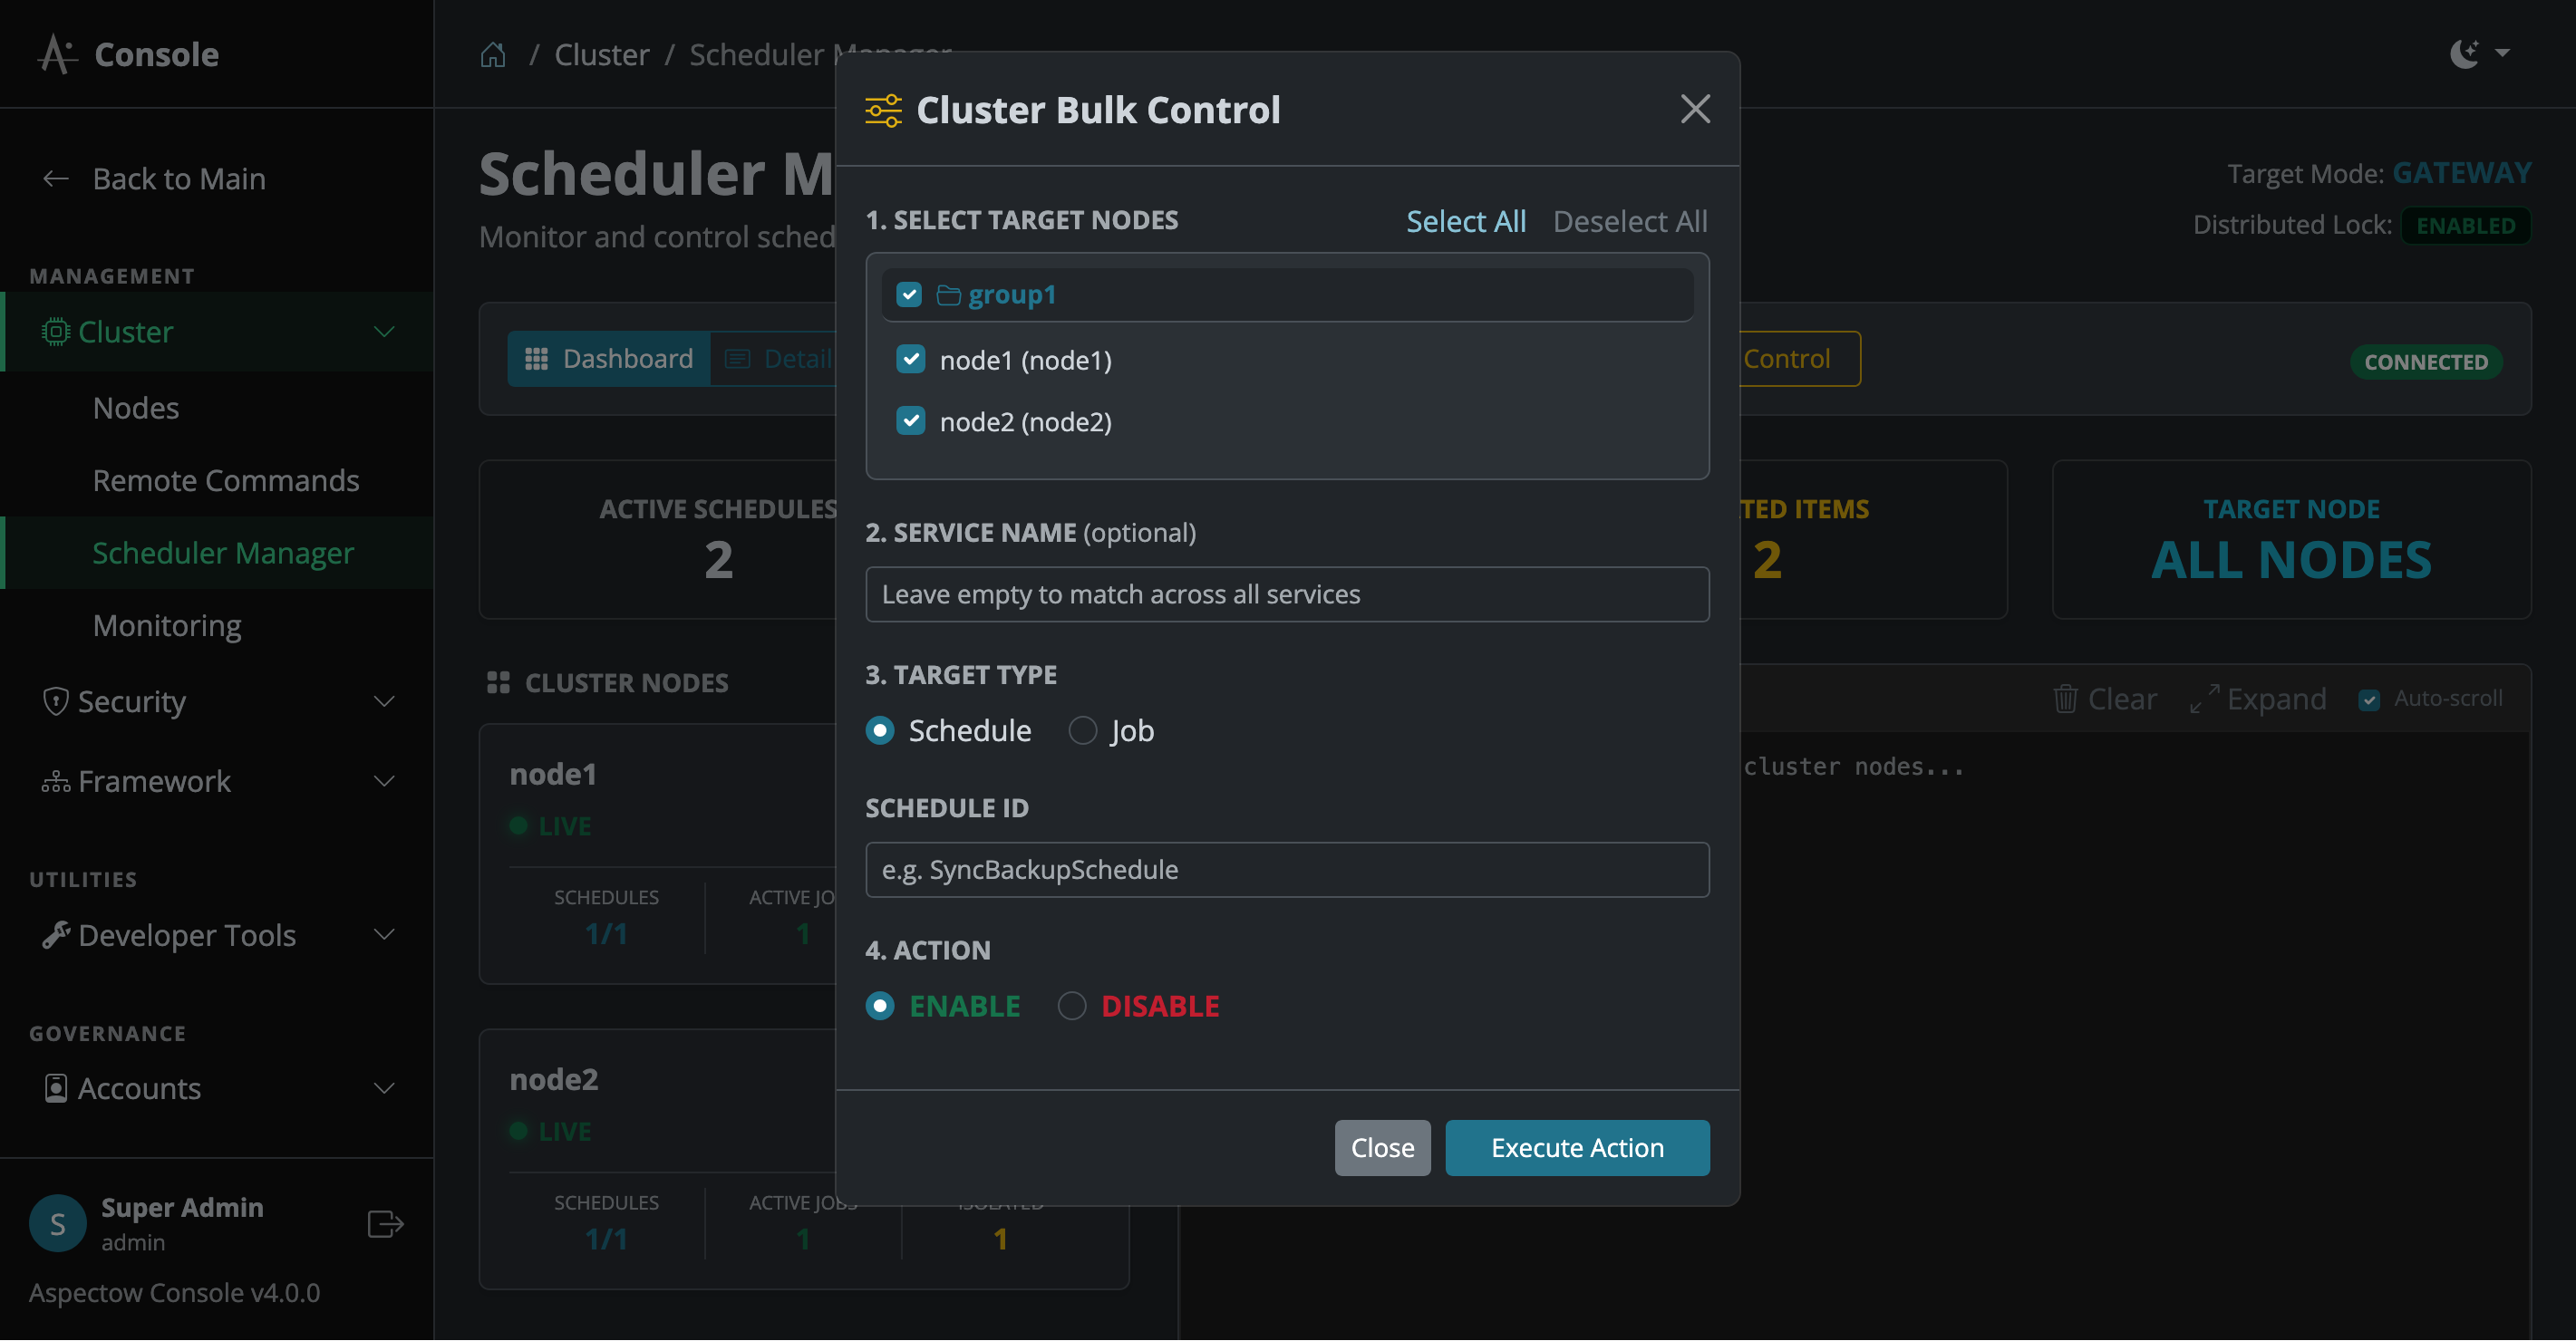
Dispatches bulk control commands for specific schedules or jobs across multiple nodes in the cluster:
- 1. Select Target Nodes: Multi-select target nodes using checkboxes or
Select All/Deselect Allbuttons. - 2. Service Name (Optional): Specifies the target scheduler service name (leave blank to match across all services).
- 3. Target Type & ID: Choose
ScheduleorJobas target type and enter the target identifier (Schedule ID or Job ID, e.g.,SyncBackupSchedule). - 4. Action:
- ENABLE (Bulk Enable): Enables the target schedule/job across selected nodes simultaneously.
- DISABLE (Bulk Disable): Disables (pauses) the target schedule/job across selected nodes simultaneously.
4. Live Monitoring (Aspectow AppMon)
Monitors real-time application activities, JVM resources, active sessions, and log streaming via the integrated AppMon engine inside the Console.

4.1. Group & App Tabs Navigation
- Group Tabs: Switch between logical server groups or cluster nodes.
- Application Tabs: Switch between individual application instances (
app) within the domain with seamless data synchronization across tab switches.
4.2. Server Resources & Performance Metrics
- Heap Status: Compares JVM heap memory usage with maximum limits to detect GC state and memory leaks.
- Undertow Thread Pool: Compares active threads against worker pool capacity to monitor concurrent load.
- Activity Status: Displays Active Activity count (real-time requests currently processing, e.g.,
11), Current Period Count (new entries in current 5-minute period, e.g.,+94), and Cumulative Total (total cumulative activities recorded to date, e.g.,12883893). - 5-Minute Aggregation Timer: Displays 300-second timer progress (e.g.,
280/300). Upon reaching300/300, data is persisted to the database and chart metrics roll over.
4.3. Canvas Traffic Flow Visualization
Visualizes incoming user requests (Activity) as animated ‘bullets’ moving from left to right across the canvas.
- Response Time Deceleration: Bullet speed decelerates up to 60% based on response time, providing visual feedback on system latency.
- Persistence & Hot Core: Heavy requests stick longer on the right wall, and high-intensity requests from heavy users render a Hot Core center for immediate identification.
- Status Color Coding: Green (Normal), Yellow (Warning > 500ms), Red (Error).
4.4. Session Management & Geo Location
- IP Geo Location: Resolves client IP addresses to render country flag icons in real time.
- Session Activity Counts: Lists active sessions along with real-time activity counts to detect heavy users.
4.5. Multi-dimensional Charts & Log Console
- TimeSeries Charts: Analyzes activity and session trends across 5-minute, hour, day, month, and year units.
- Real-time Log Tailing: Socket-based log streaming with Pause, Clear, and Full-screen options.
- Reverse Log Scrolling: Scrolling to the top activates ‘Load Previous Logs’ to fetch historical logs contextually.
5. Security & Vault Management
Centralized management for system encryption configurations and security tokens built upon Aspectran’s built-in Password-Based Encryption (PBE) engine.
5.1. Vault Management
A dedicated vault management screen designed to securely store and govern Aspectran PBE-based security tokens. Rather than integrating an external third-party vault system, it provides a built-in cryptographic vault that encrypts and isolates sensitive assets (e.g., database credentials, API keys) into structured PBE tokens, completely eliminating plaintext exposure in configuration files.
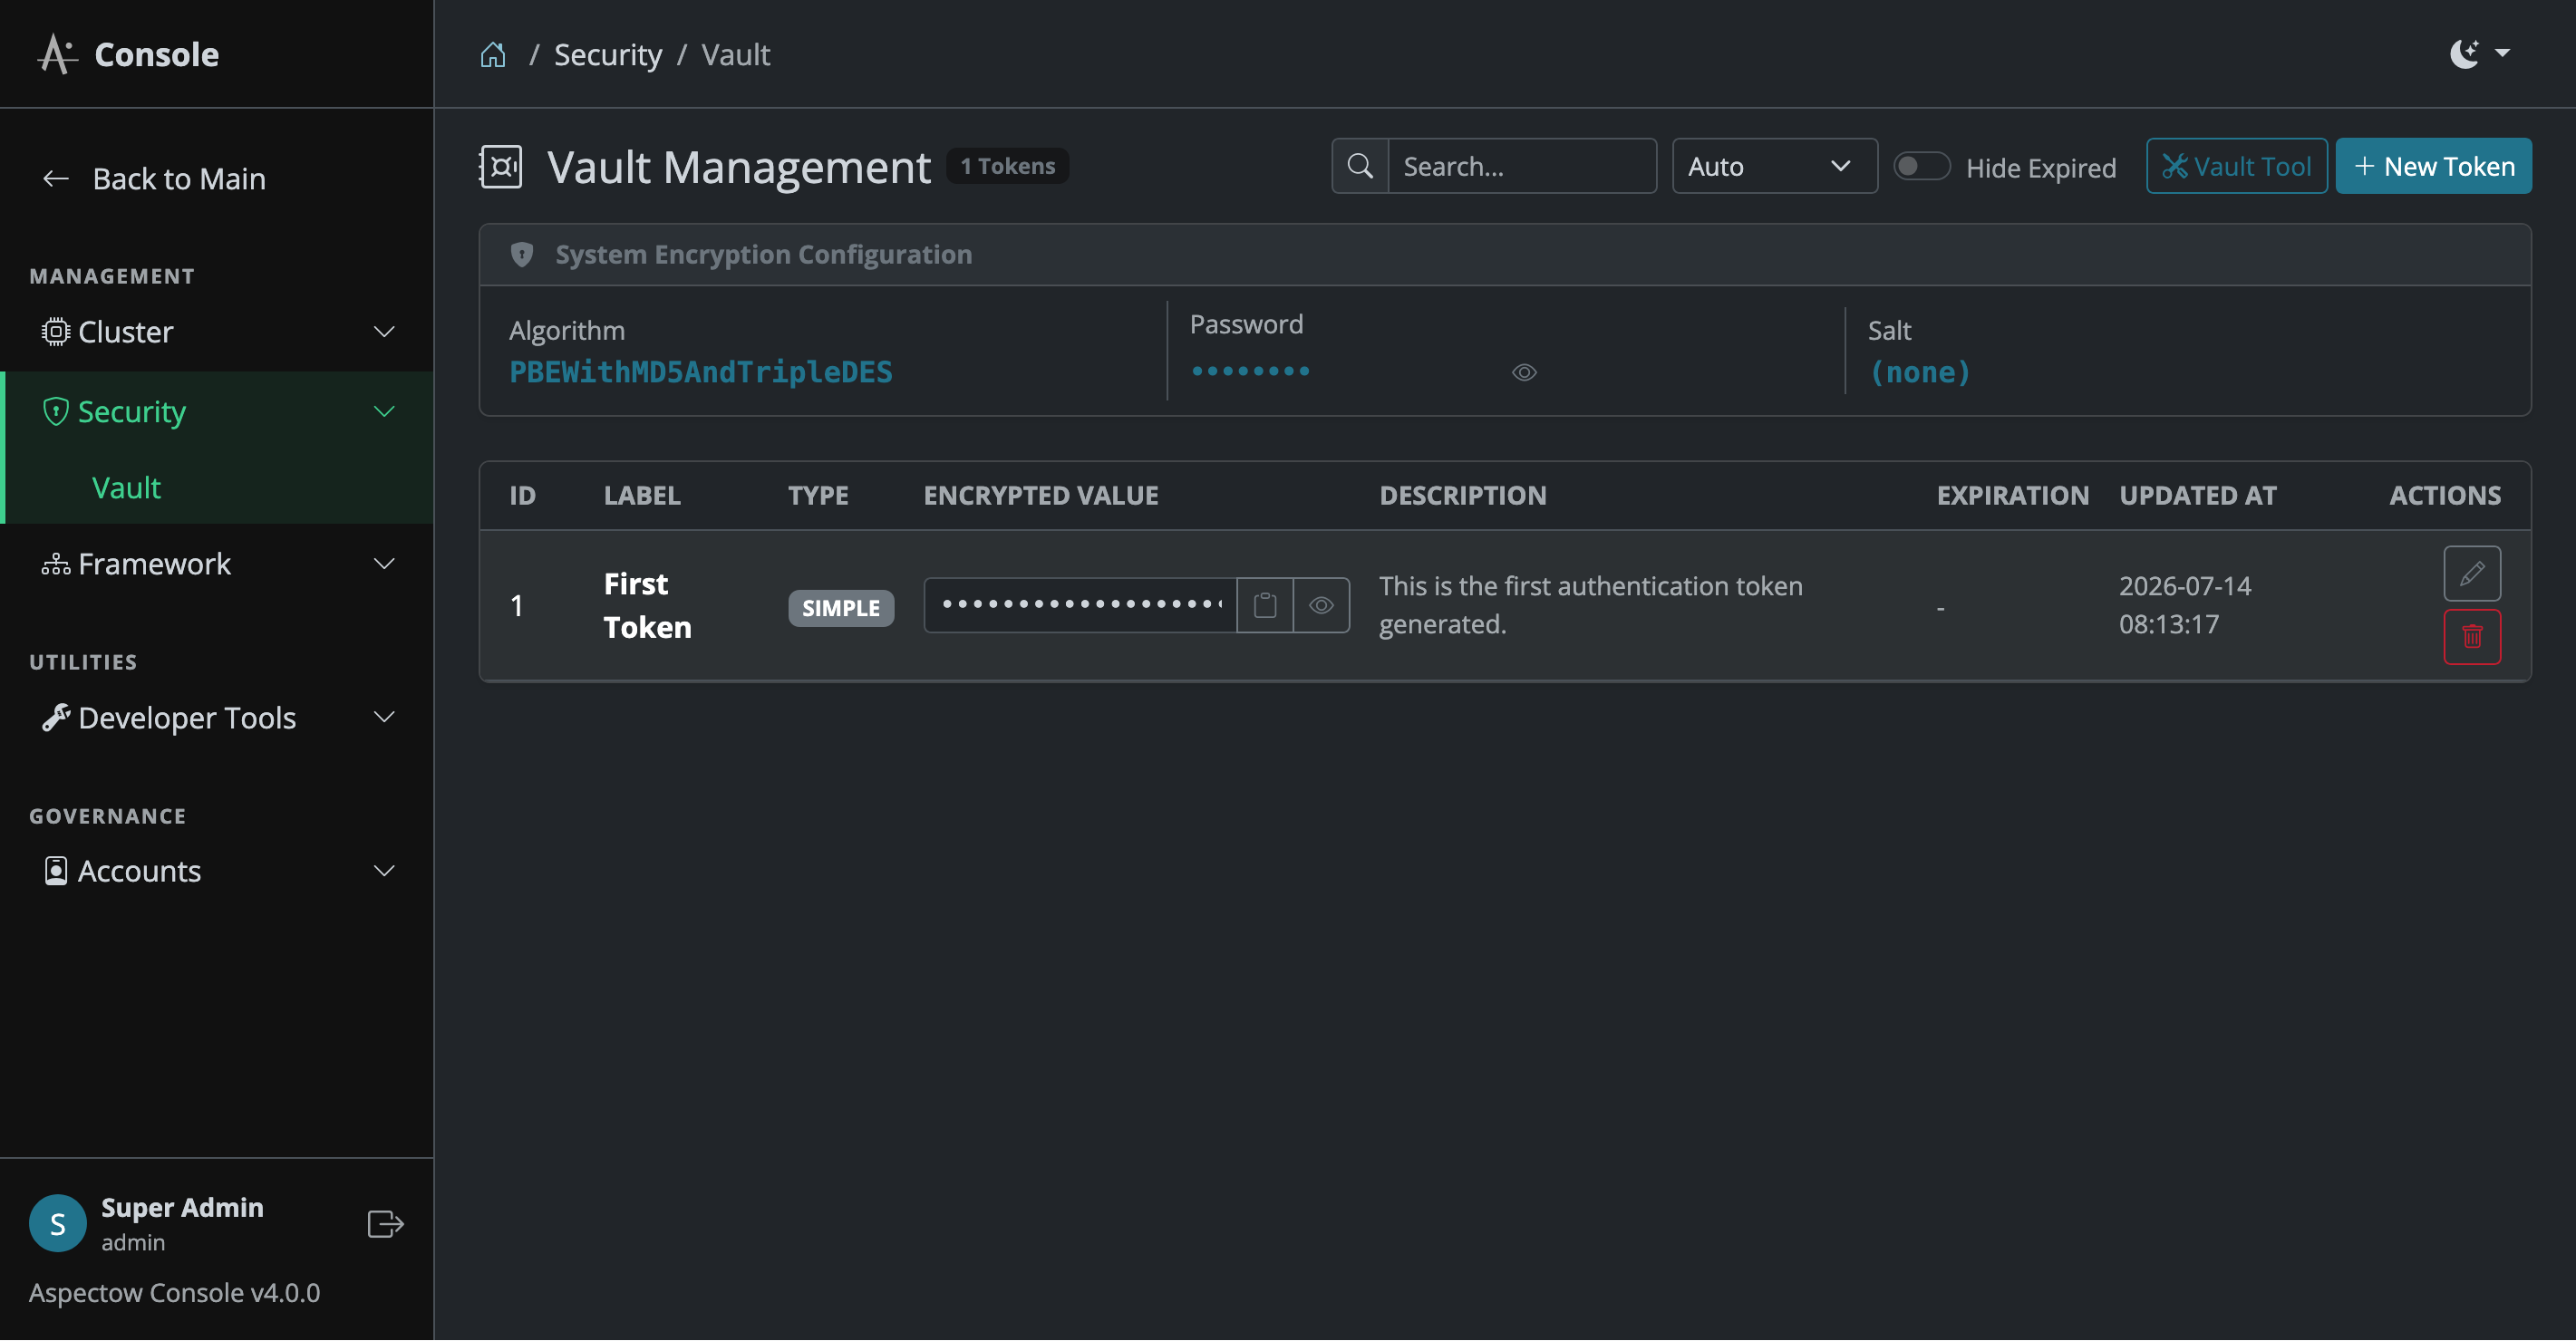
Control Bar
- Total Tokens Badge: Displays total registered security token count.
- Search Field: Real-time search by token label or keyword.
- Page Size Select: Choose page size (Auto, 10, 20, 30, 50, 100).
- Hide Expired Toggle: Hide or show expired tokens in the list.
- New Token Button: Invokes the new security token issuance modal.
System Encryption Configuration Card
Header card validating current application system encryption configuration:
- PBE Algorithm: Applied encryption algorithm (e.g.,
PBEWithHmacSHA256AndAES_256). - Key Parameters: Key Length, Iteration Count, and Salt Generator parameters.
Token Details List
Lists token Label, encrypted key/value preview, creation date, expiration date, and status badges (Active/Expired), with Copy Key, View Details, and Revoke actions.
New Security Token Issuance Modal
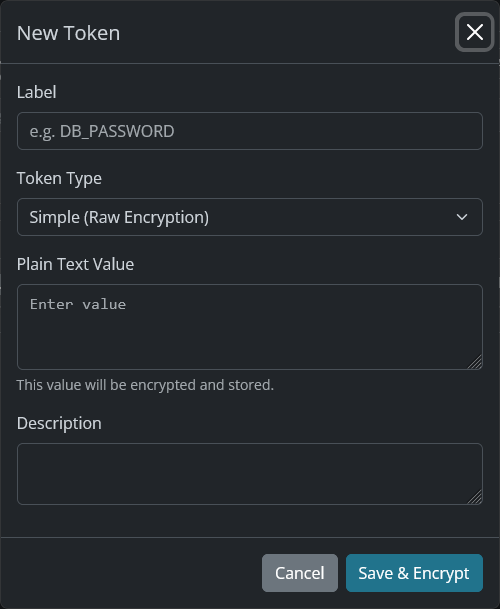
Issues new security tokens and encrypts payload data using PBE algorithms:
- Label: Unique token identifier (e.g.,
DB_PASSWORD,API_SECRET_KEY). - Token Type:
SIMPLE: Raw string PBE encryption payload directly stored.PERSISTENT: Persistent token payload formatted via APON.TIME_LIMITED: Time-limited token payload with APON formatting and expiration limits.
- Plain Text Value: Plaintext data to be encrypted and stored (multi-line input field).
- Description: Description of token usage.
- Expiration (Minutes): Validity period in minutes (
0for non-expiring permanent tokens). - Security Restrictions: Upon clicking
Save & Encrypt, plaintext values are encrypted. For security integrity, token type, validity period, and plaintext values become read-only post-issuance.
5.2. Vault Tool
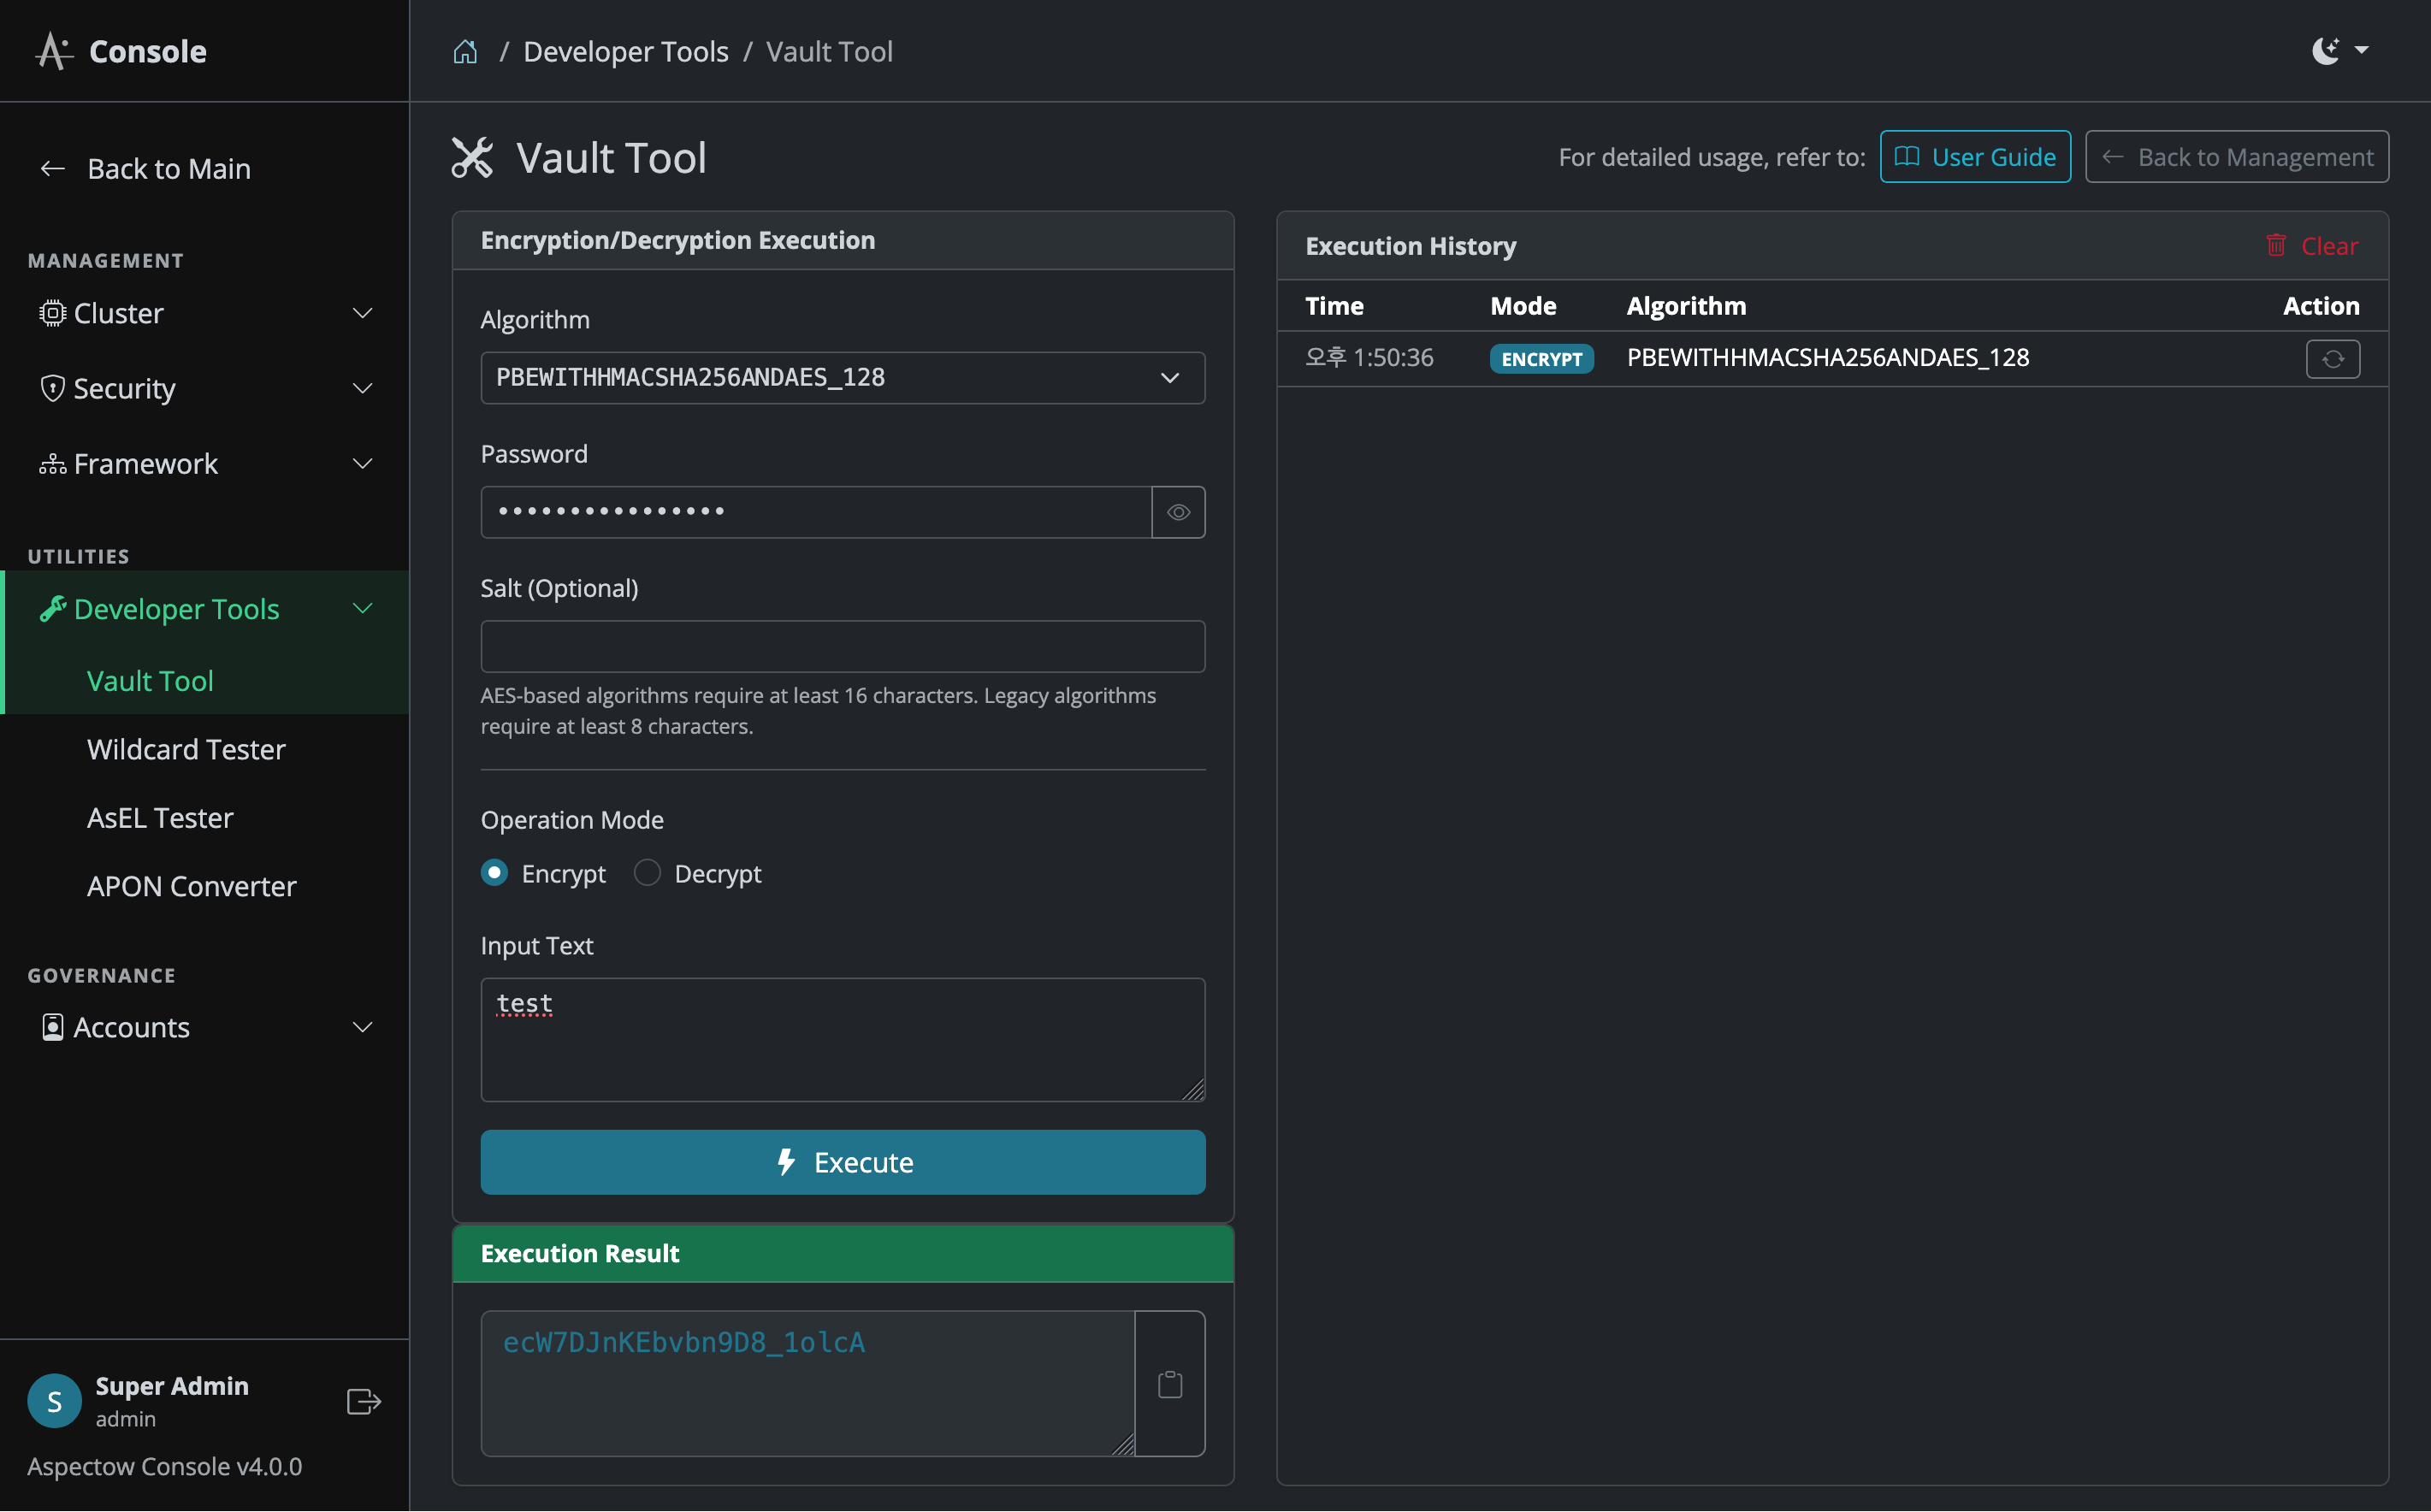
Interactive laboratory tool allowing developers to encrypt or decrypt sensitive credentials (DB passwords, API keys, etc.).
- Encryption/Decryption Execution Form: Configure Algorithm, Password, Salt (optional), and Operation Mode (Encrypt/Decrypt) to execute text encryption or decryption.
- Execution Result & History: Provides result text clipboard copying and an execution history panel to inspect past runs (Timestamp, Mode, Algorithm) and easily restore them for re-execution.
6. Framework Diagnostics & Developer Tools
A suite of tools for Aspectran framework runtime diagnostics and developer productivity.
6.1. Framework Configuration Viewer
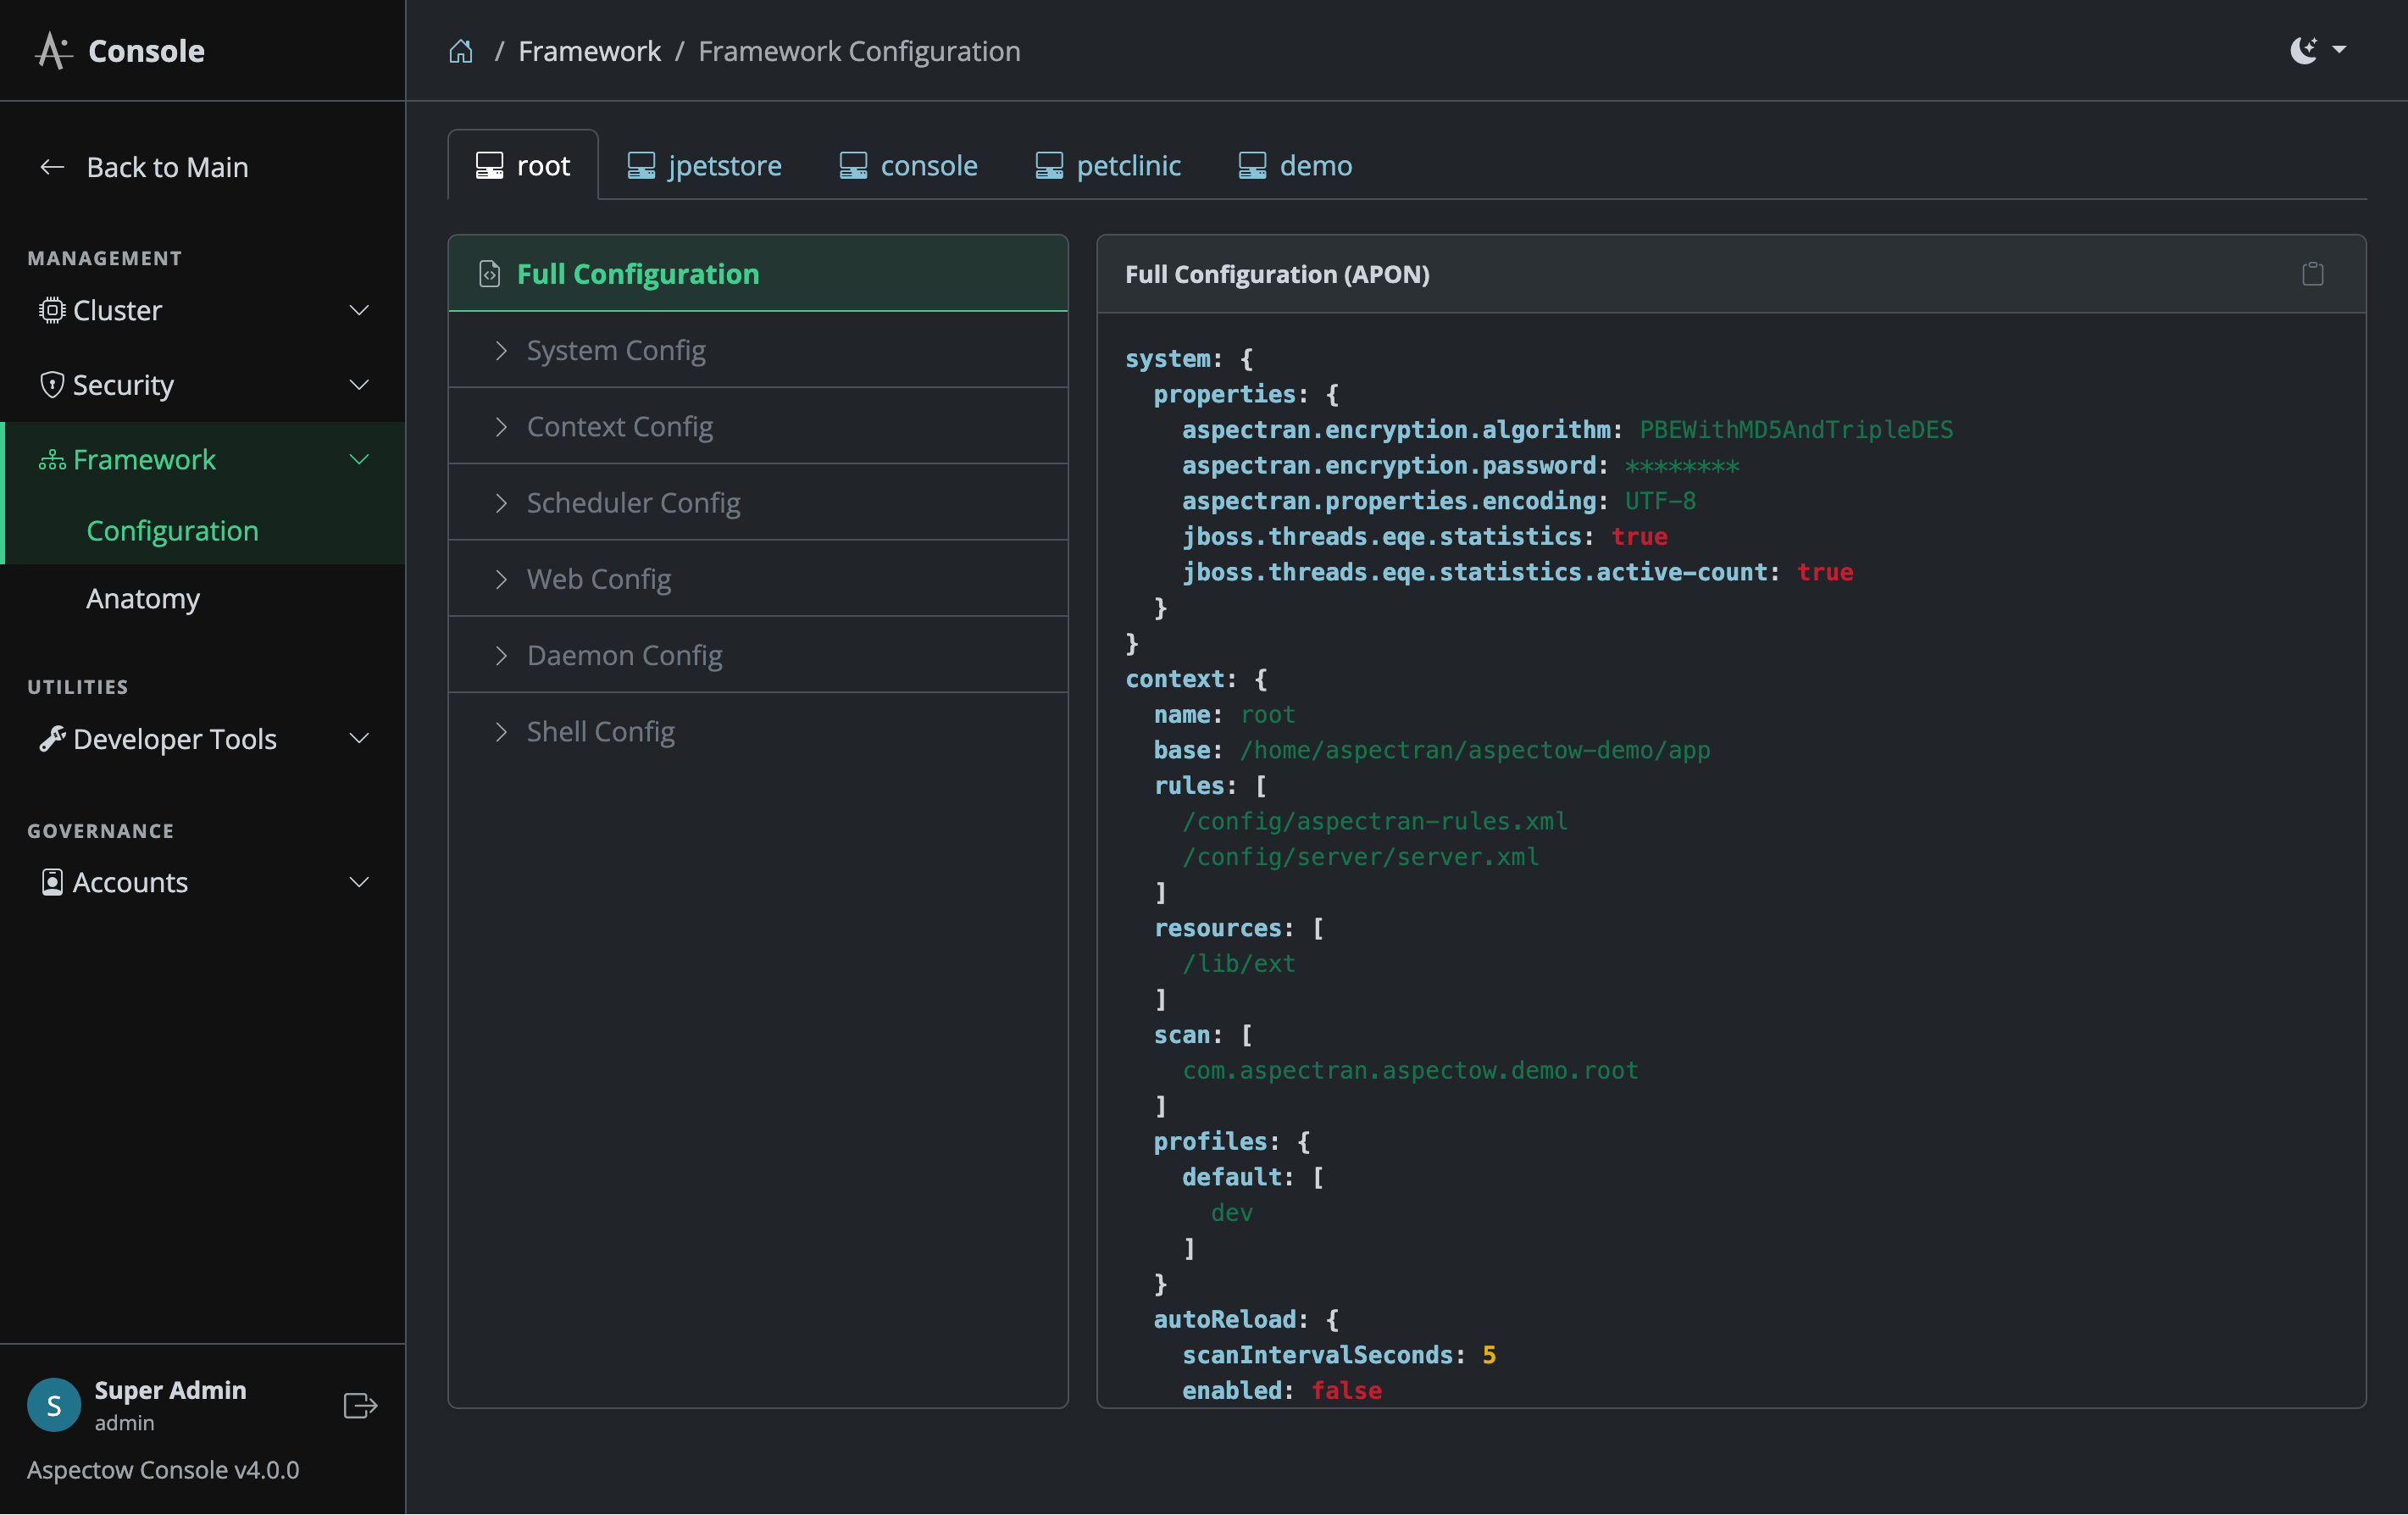
Inspects runtime framework configurations, rule file hierarchy, and active profiles (dev, prod, test).
6.2. Framework Anatomy Viewer
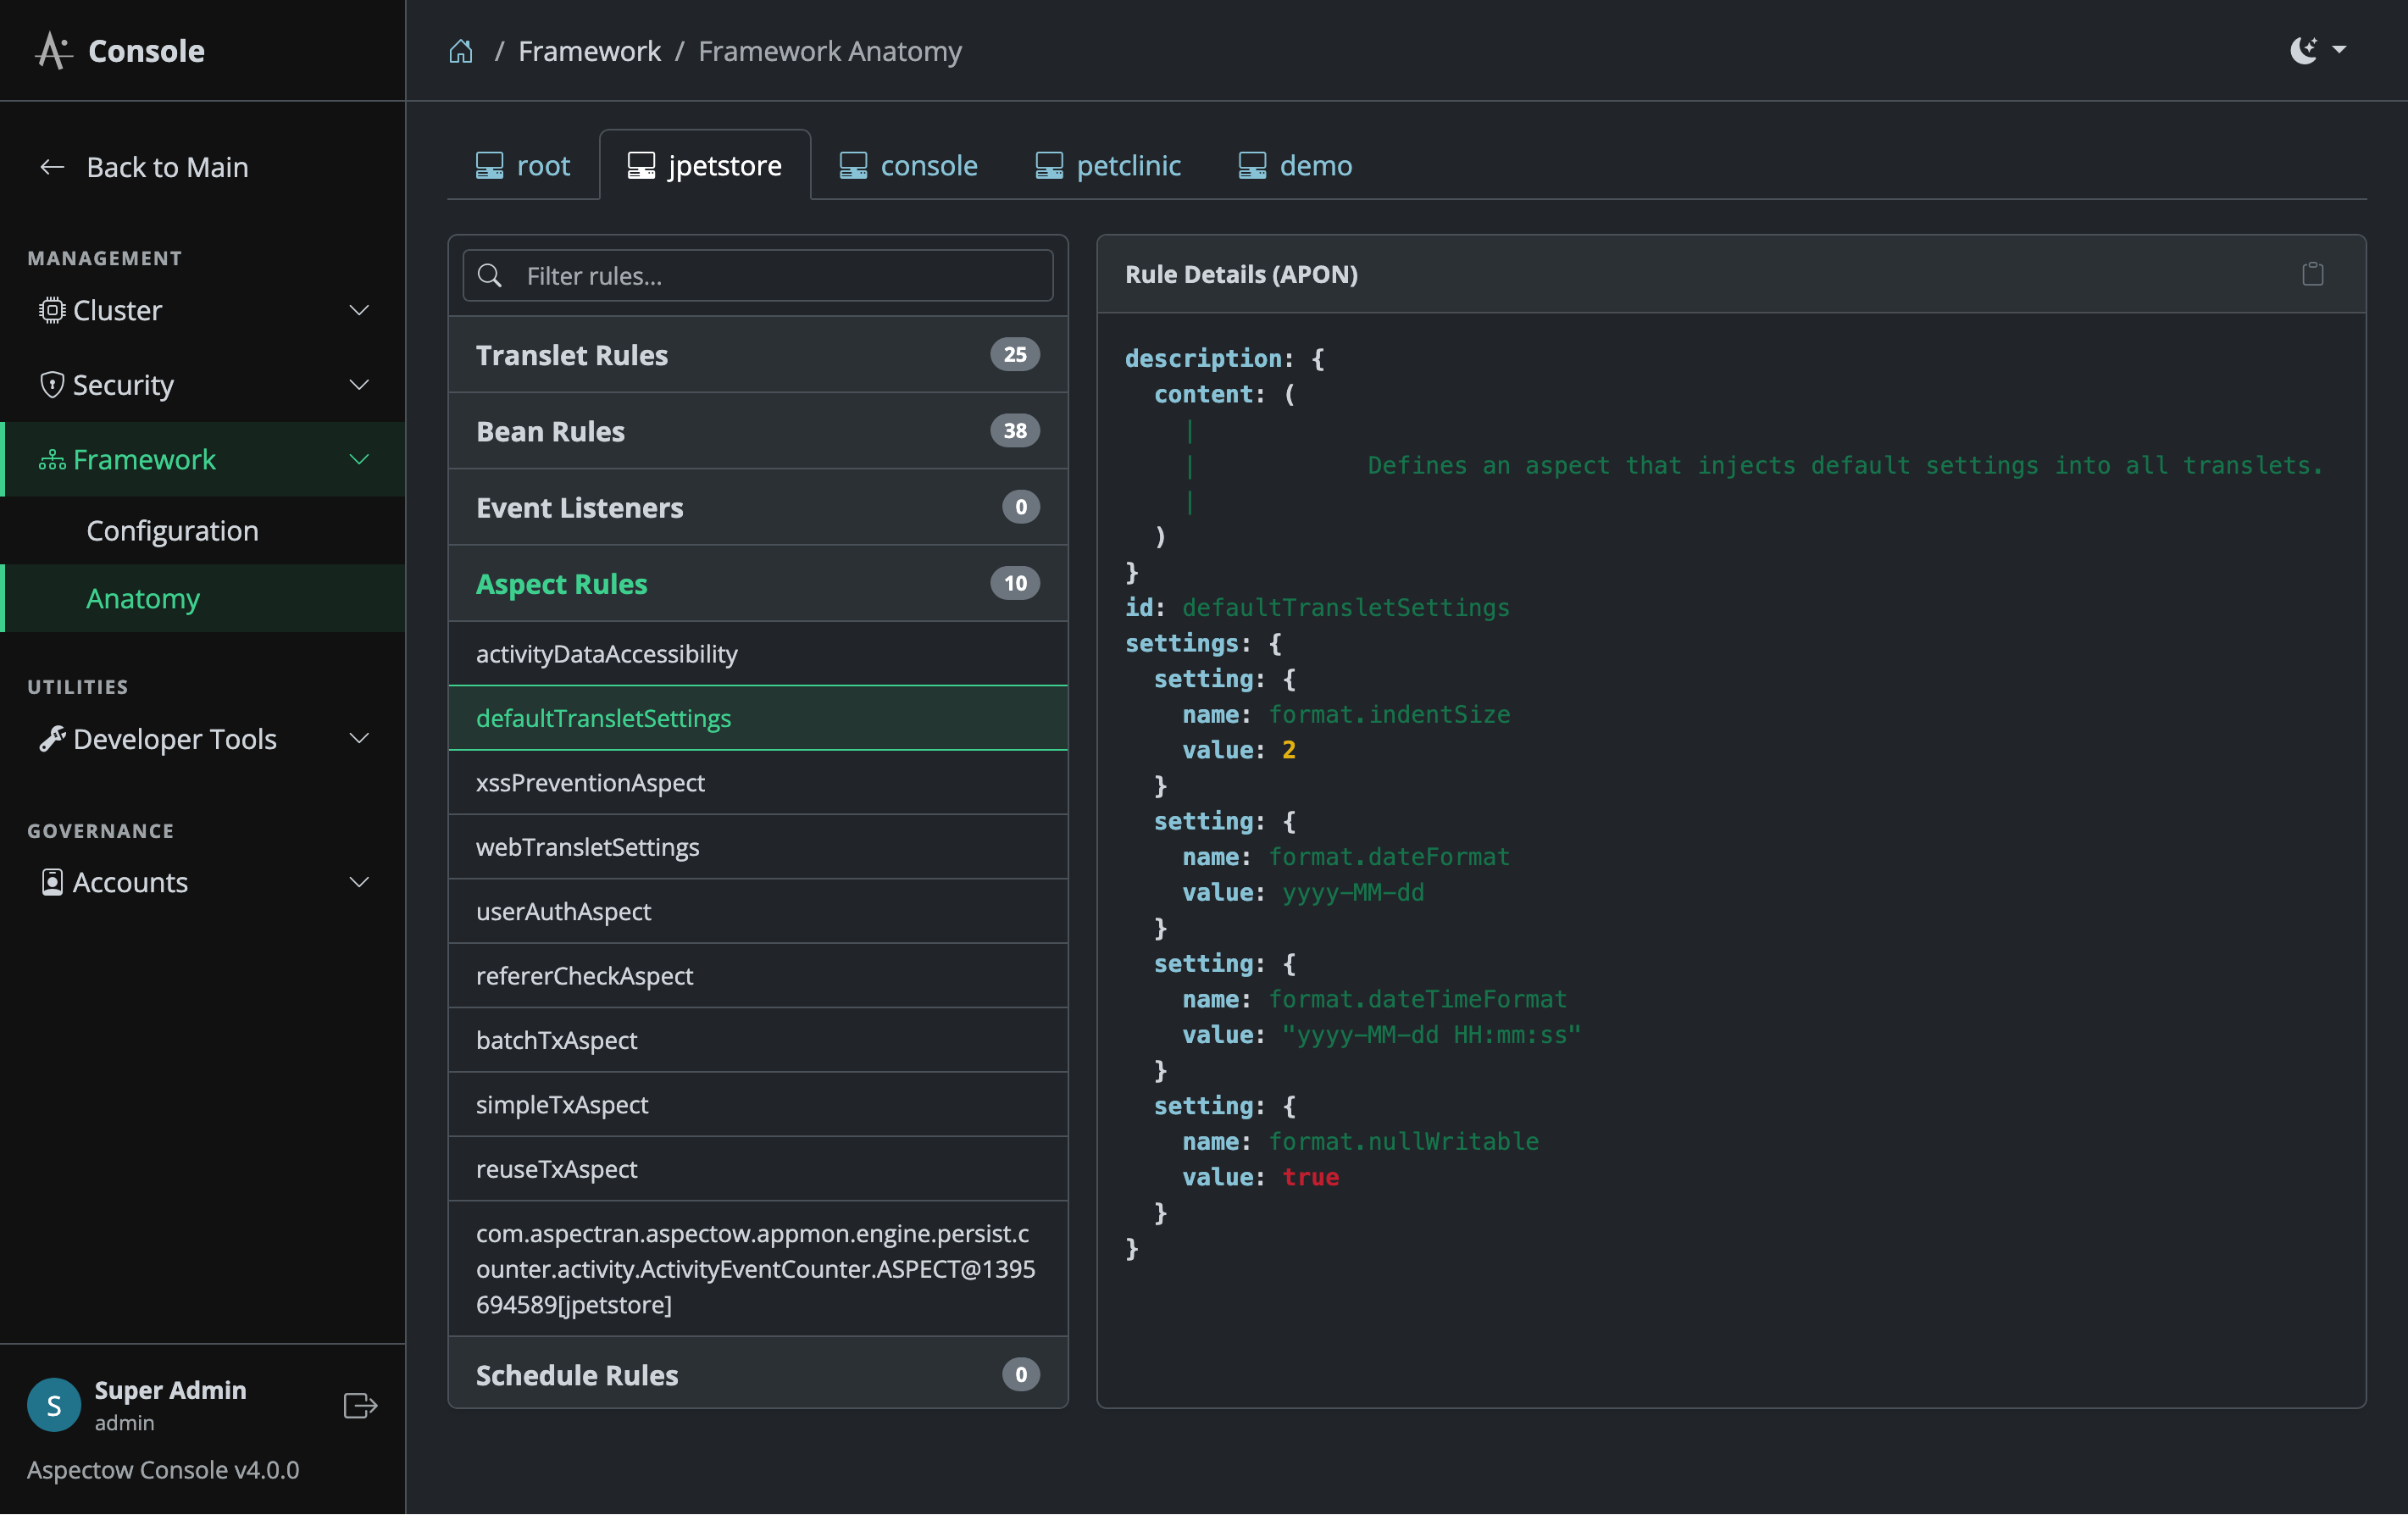
Inspects internal ActivityContext registries:
- Bean Registry: Registered bean IDs, class types, scopes (singleton, prototype, request, session), lazy-init settings, and dependencies.
- Translet Registry: Translet mappings, HTTP method bindings, Action execution pipelines, and View forwarding.
- Aspect Registry: AOP Pointcut patterns and Advice (Before/After/Around) definitions.
6.3. Wildcard Tester

Tests Aspectran wildcard pattern matcher rules in real time. Clicking the Wildcard Guide button links directly to the official Aspectran Wildcard Pattern Matching Guide for pattern syntax documentation.
- Pattern Input: Input pattern to test (e.g.,
/users/**/details,*.do). - Test Paths: Inject sample test paths.
- Match Results: Displays match success/mismatch status and extracted variable bindings in real time.
6.4. AsEL Tester
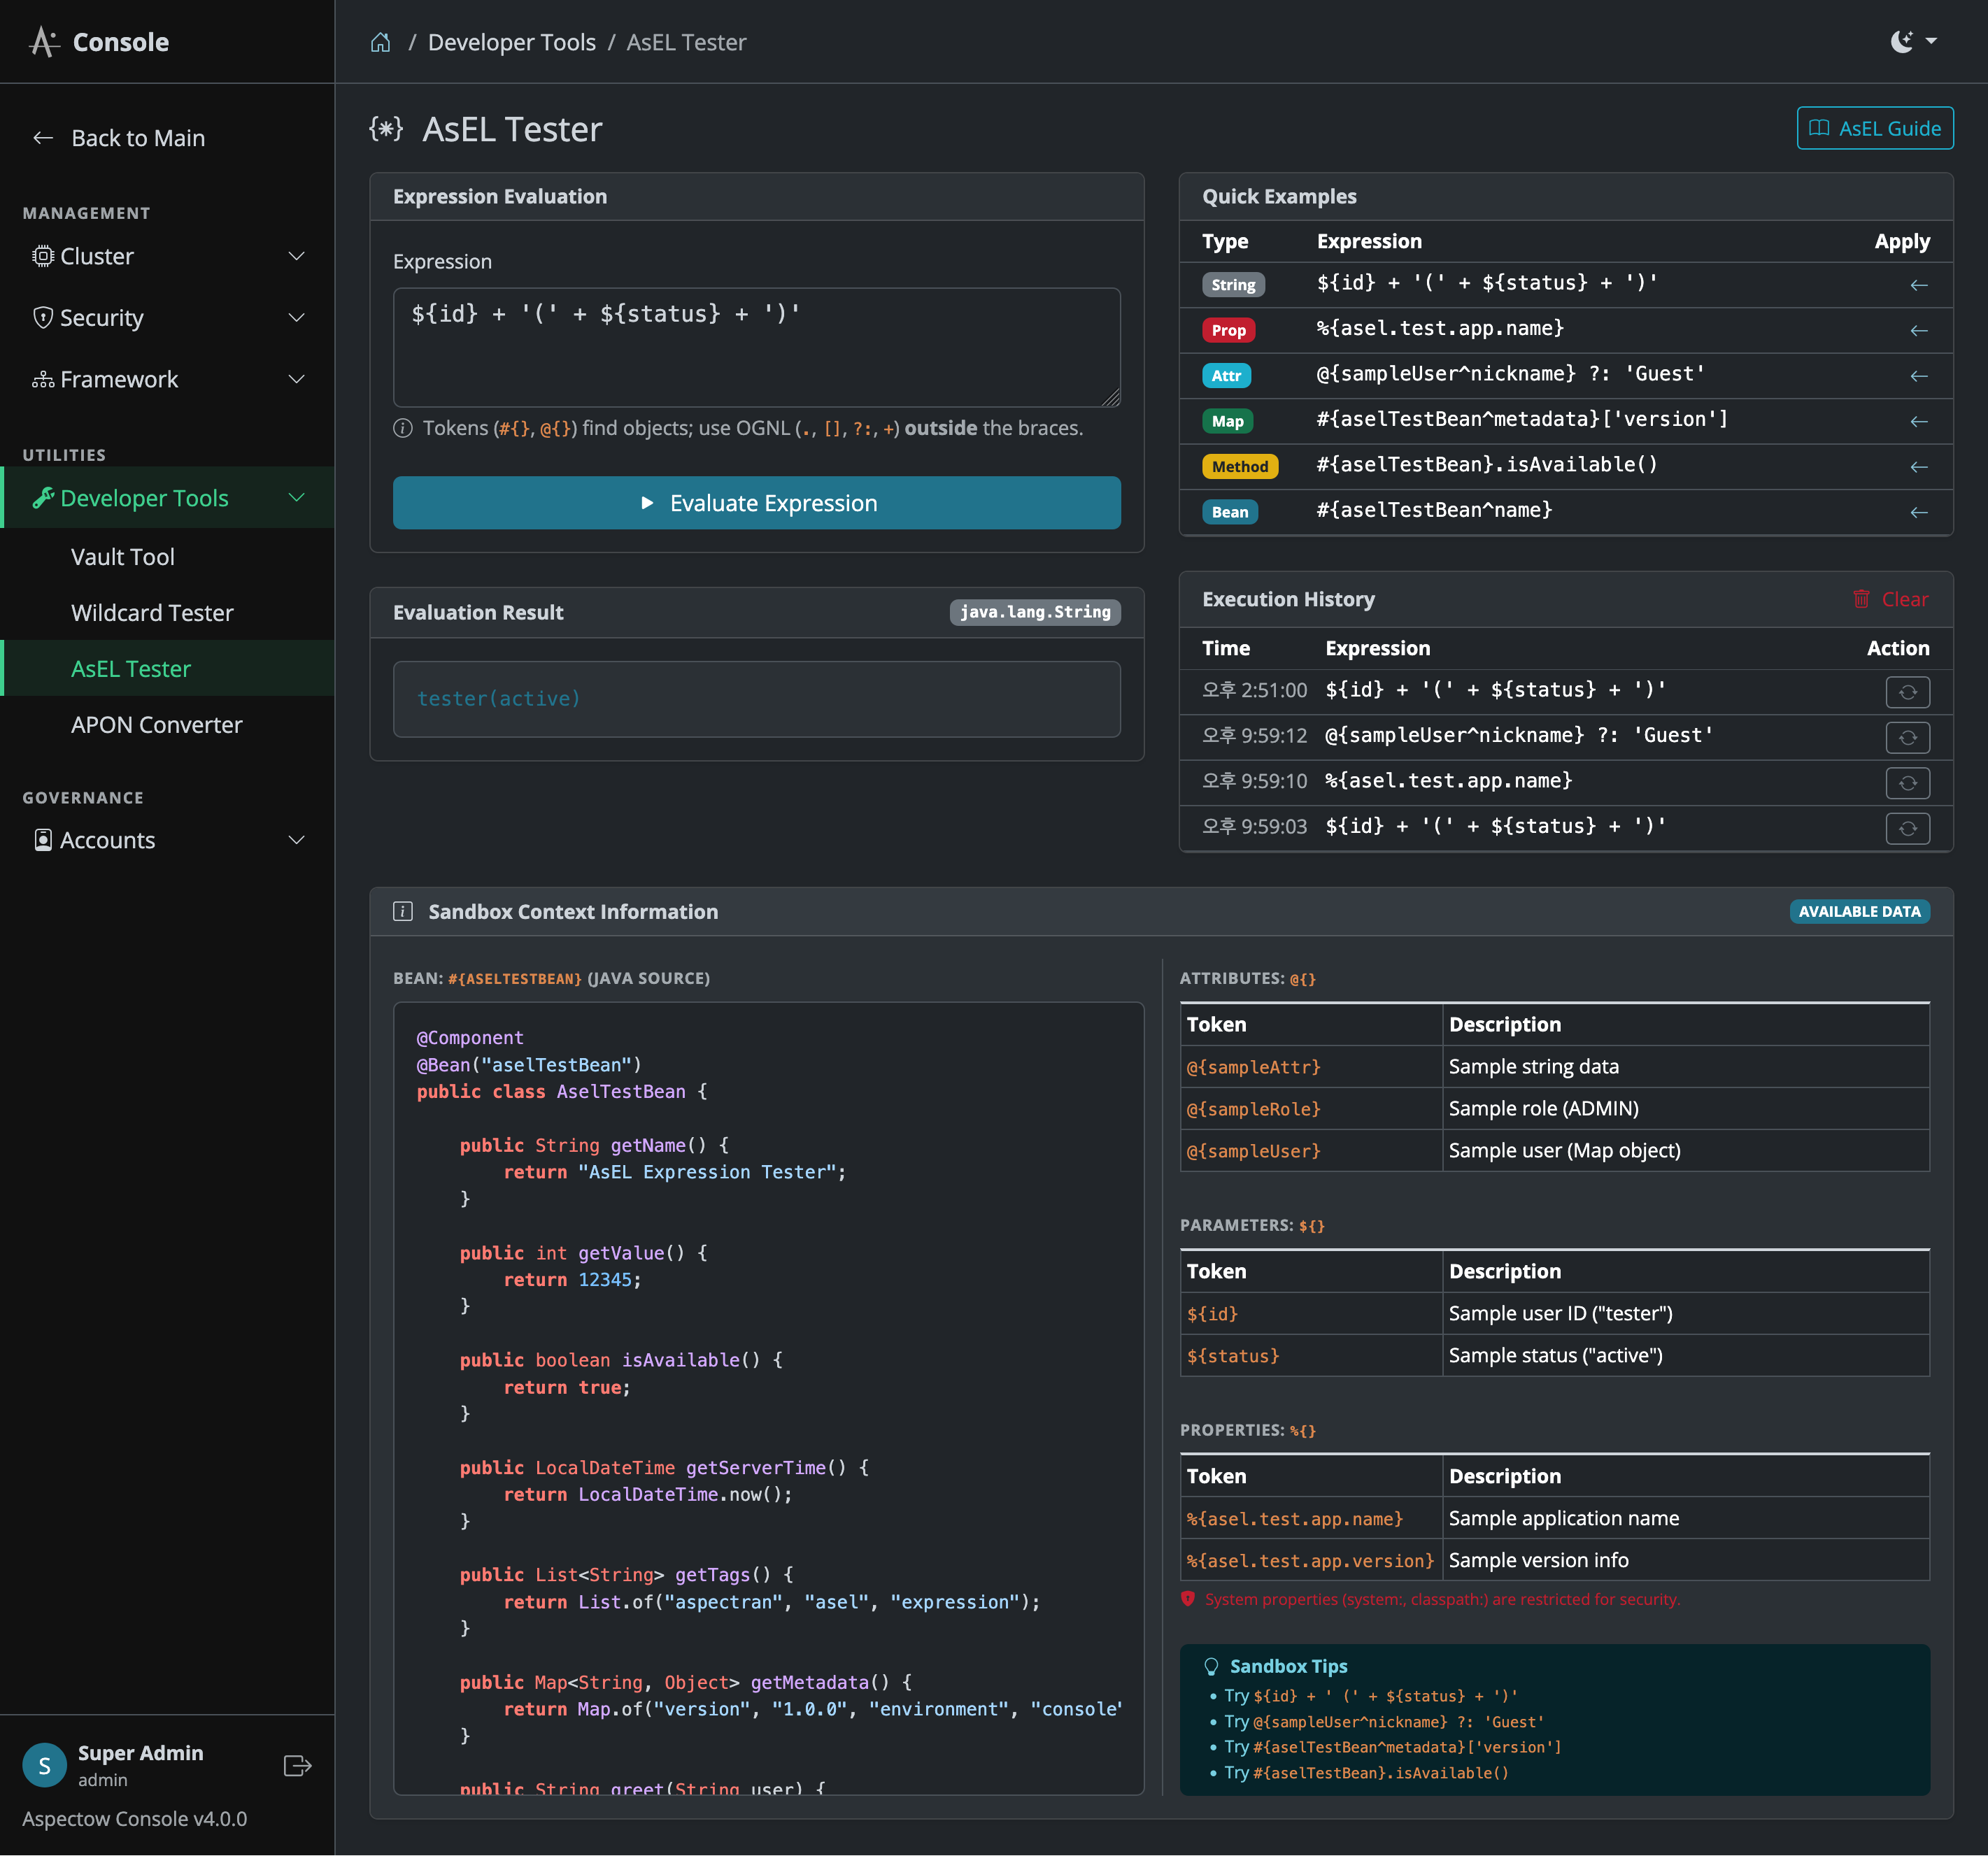
Evaluates Aspectran Expression Language (AsEL) expressions interactively. Clicking the AsEL Guide button links to the official Introduction to AsEL (Aspectran Expression Language) documentation.
- Expression Input: AsEL expression input (e.g.,
#{sysProps['user.home']},@{beanId.methodName()}). - Context Variables: Sample context variable inputs.
- Evaluation Result: Displays evaluated result, return object data type, and execution duration (ms).
6.5. APON Converter

Bi-directional converter between APON and JSON formats. Clicking the APON Guide button links directly to the official Introduction to APON (Aspectran Parameters Object Notation) documentation.
- APON Panel: Input APON text and click
Parse to JSONto convert it into JSON format. - JSON Panel: Input JSON text, choose an APON output style (
PRETTY,SINGLE_LINE,COMPACT), and clickAPONto convert it back to APON format. - Quick Tools: Provides
Clear Allfor resetting input text andLoad Samplefor loading sample APON data.
7. Governance & Accounts
This section manages Console user accounts and security audit logs.
7.1. User Management
User Accounts List
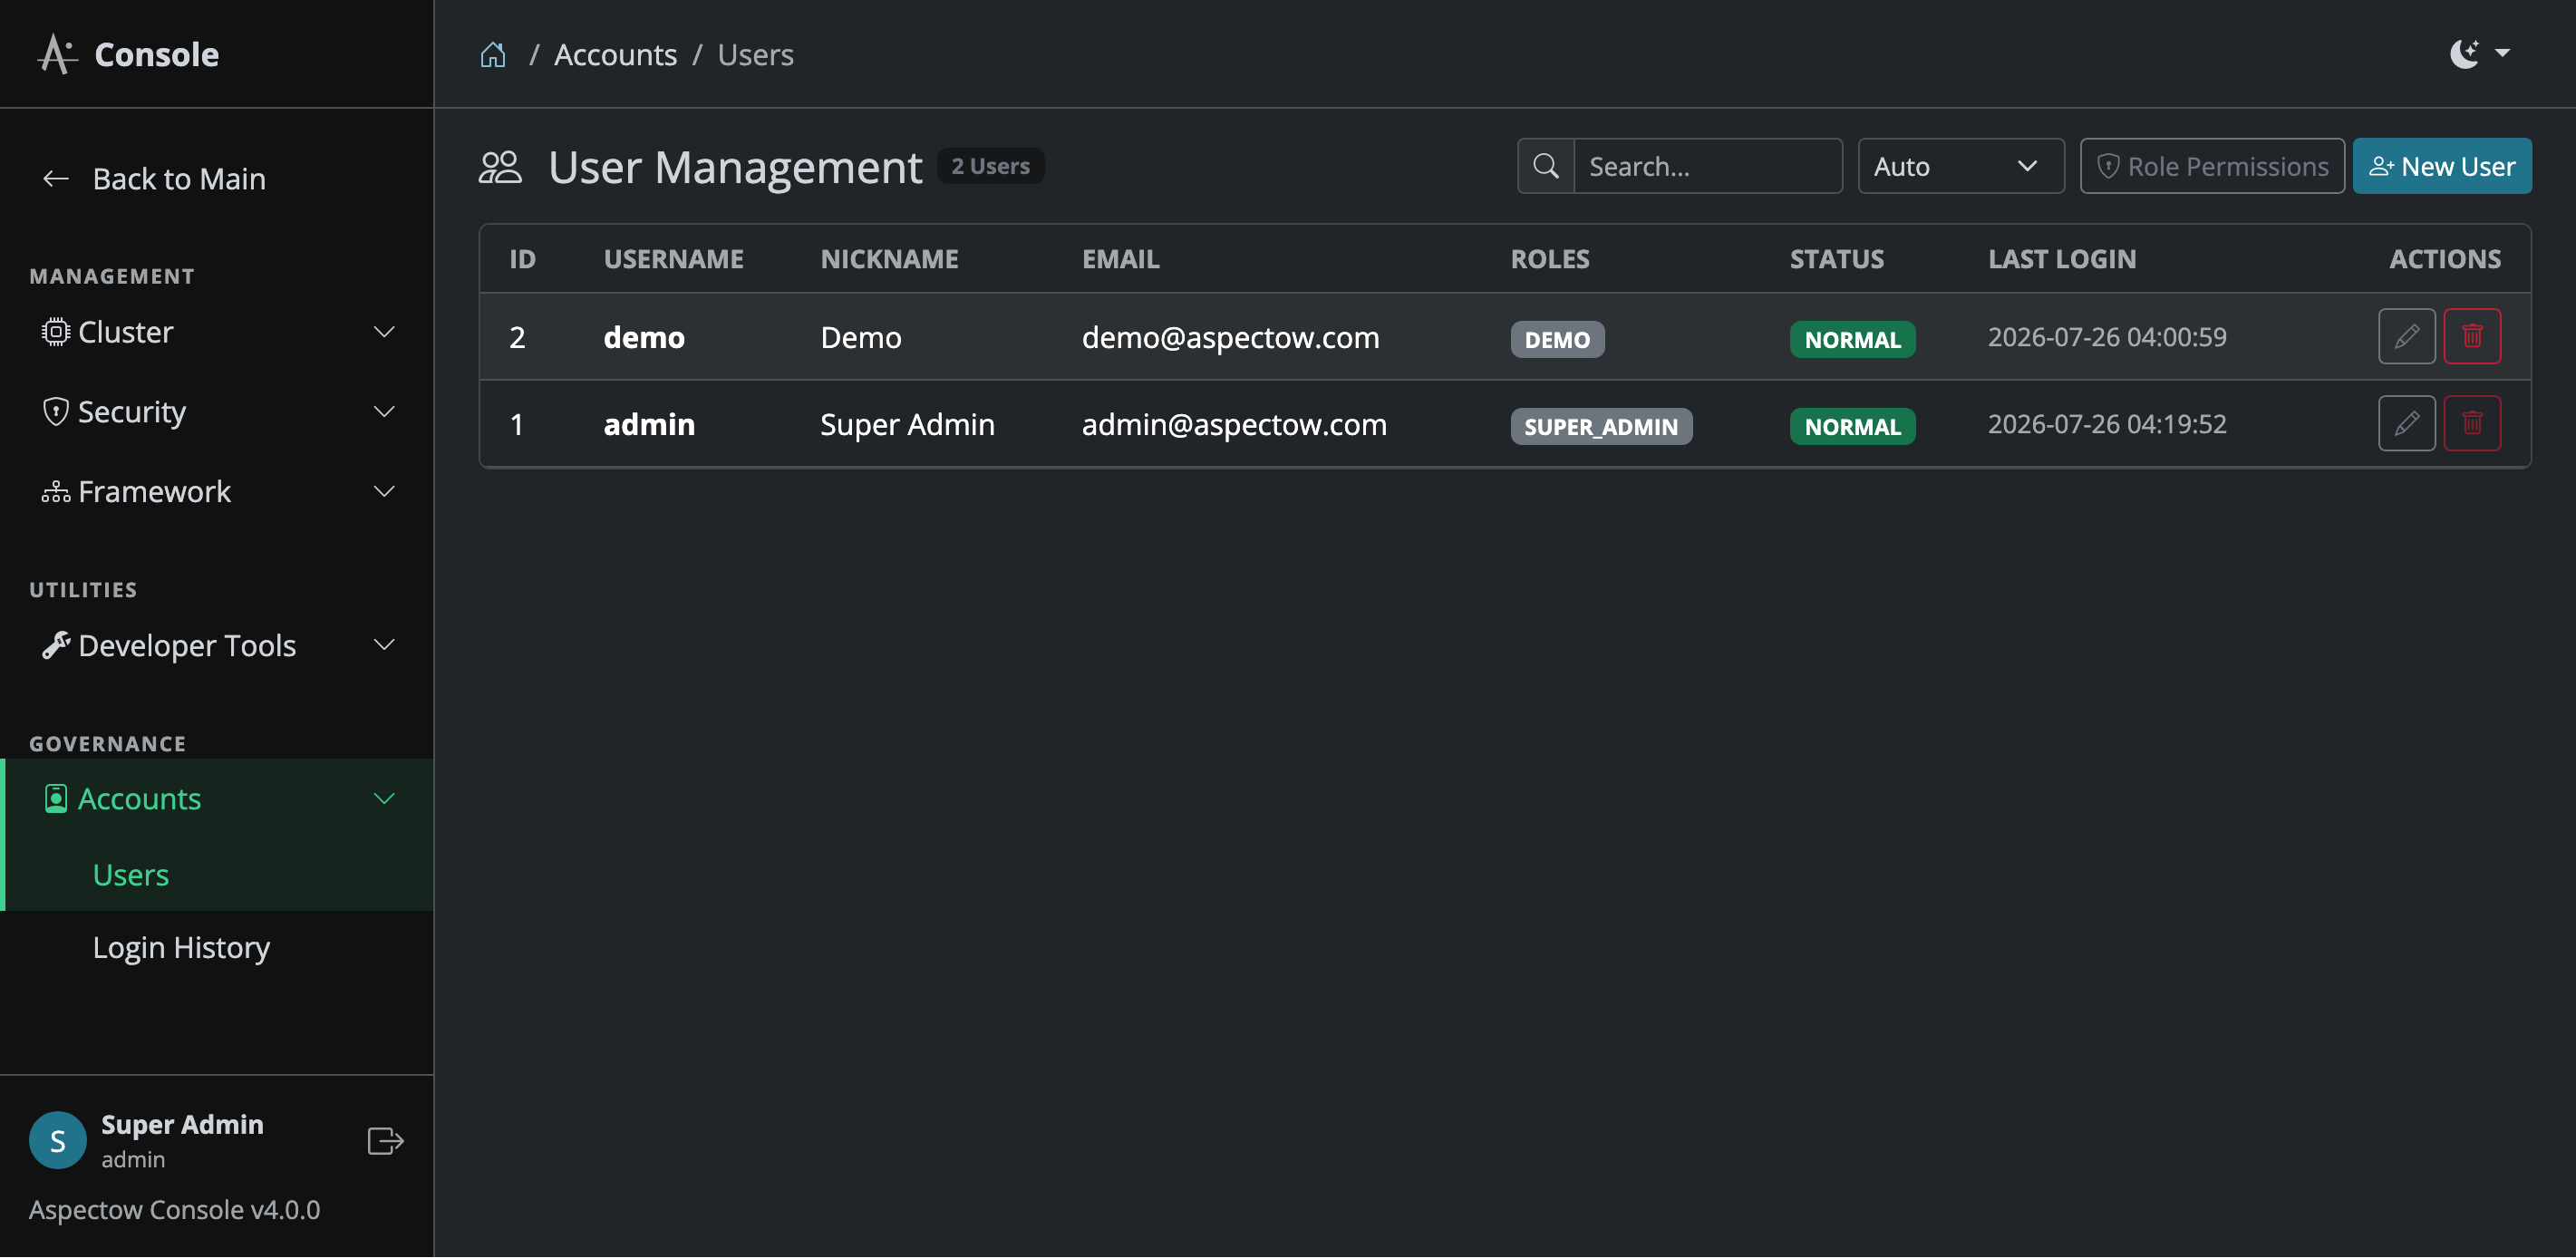
- User List & Search: Manages and filters registered console user accounts (Username, Nickname, Email, Status, Roles) in real time.
- Role Permissions Button: Visible to administrators with
USER_MANAGEpermission or theSUPER_ADMINrole to configure fine-grained role-to-permission mappings. - New User Button: Opens the user creation modal to register new user accounts.
New & Edit User Modal
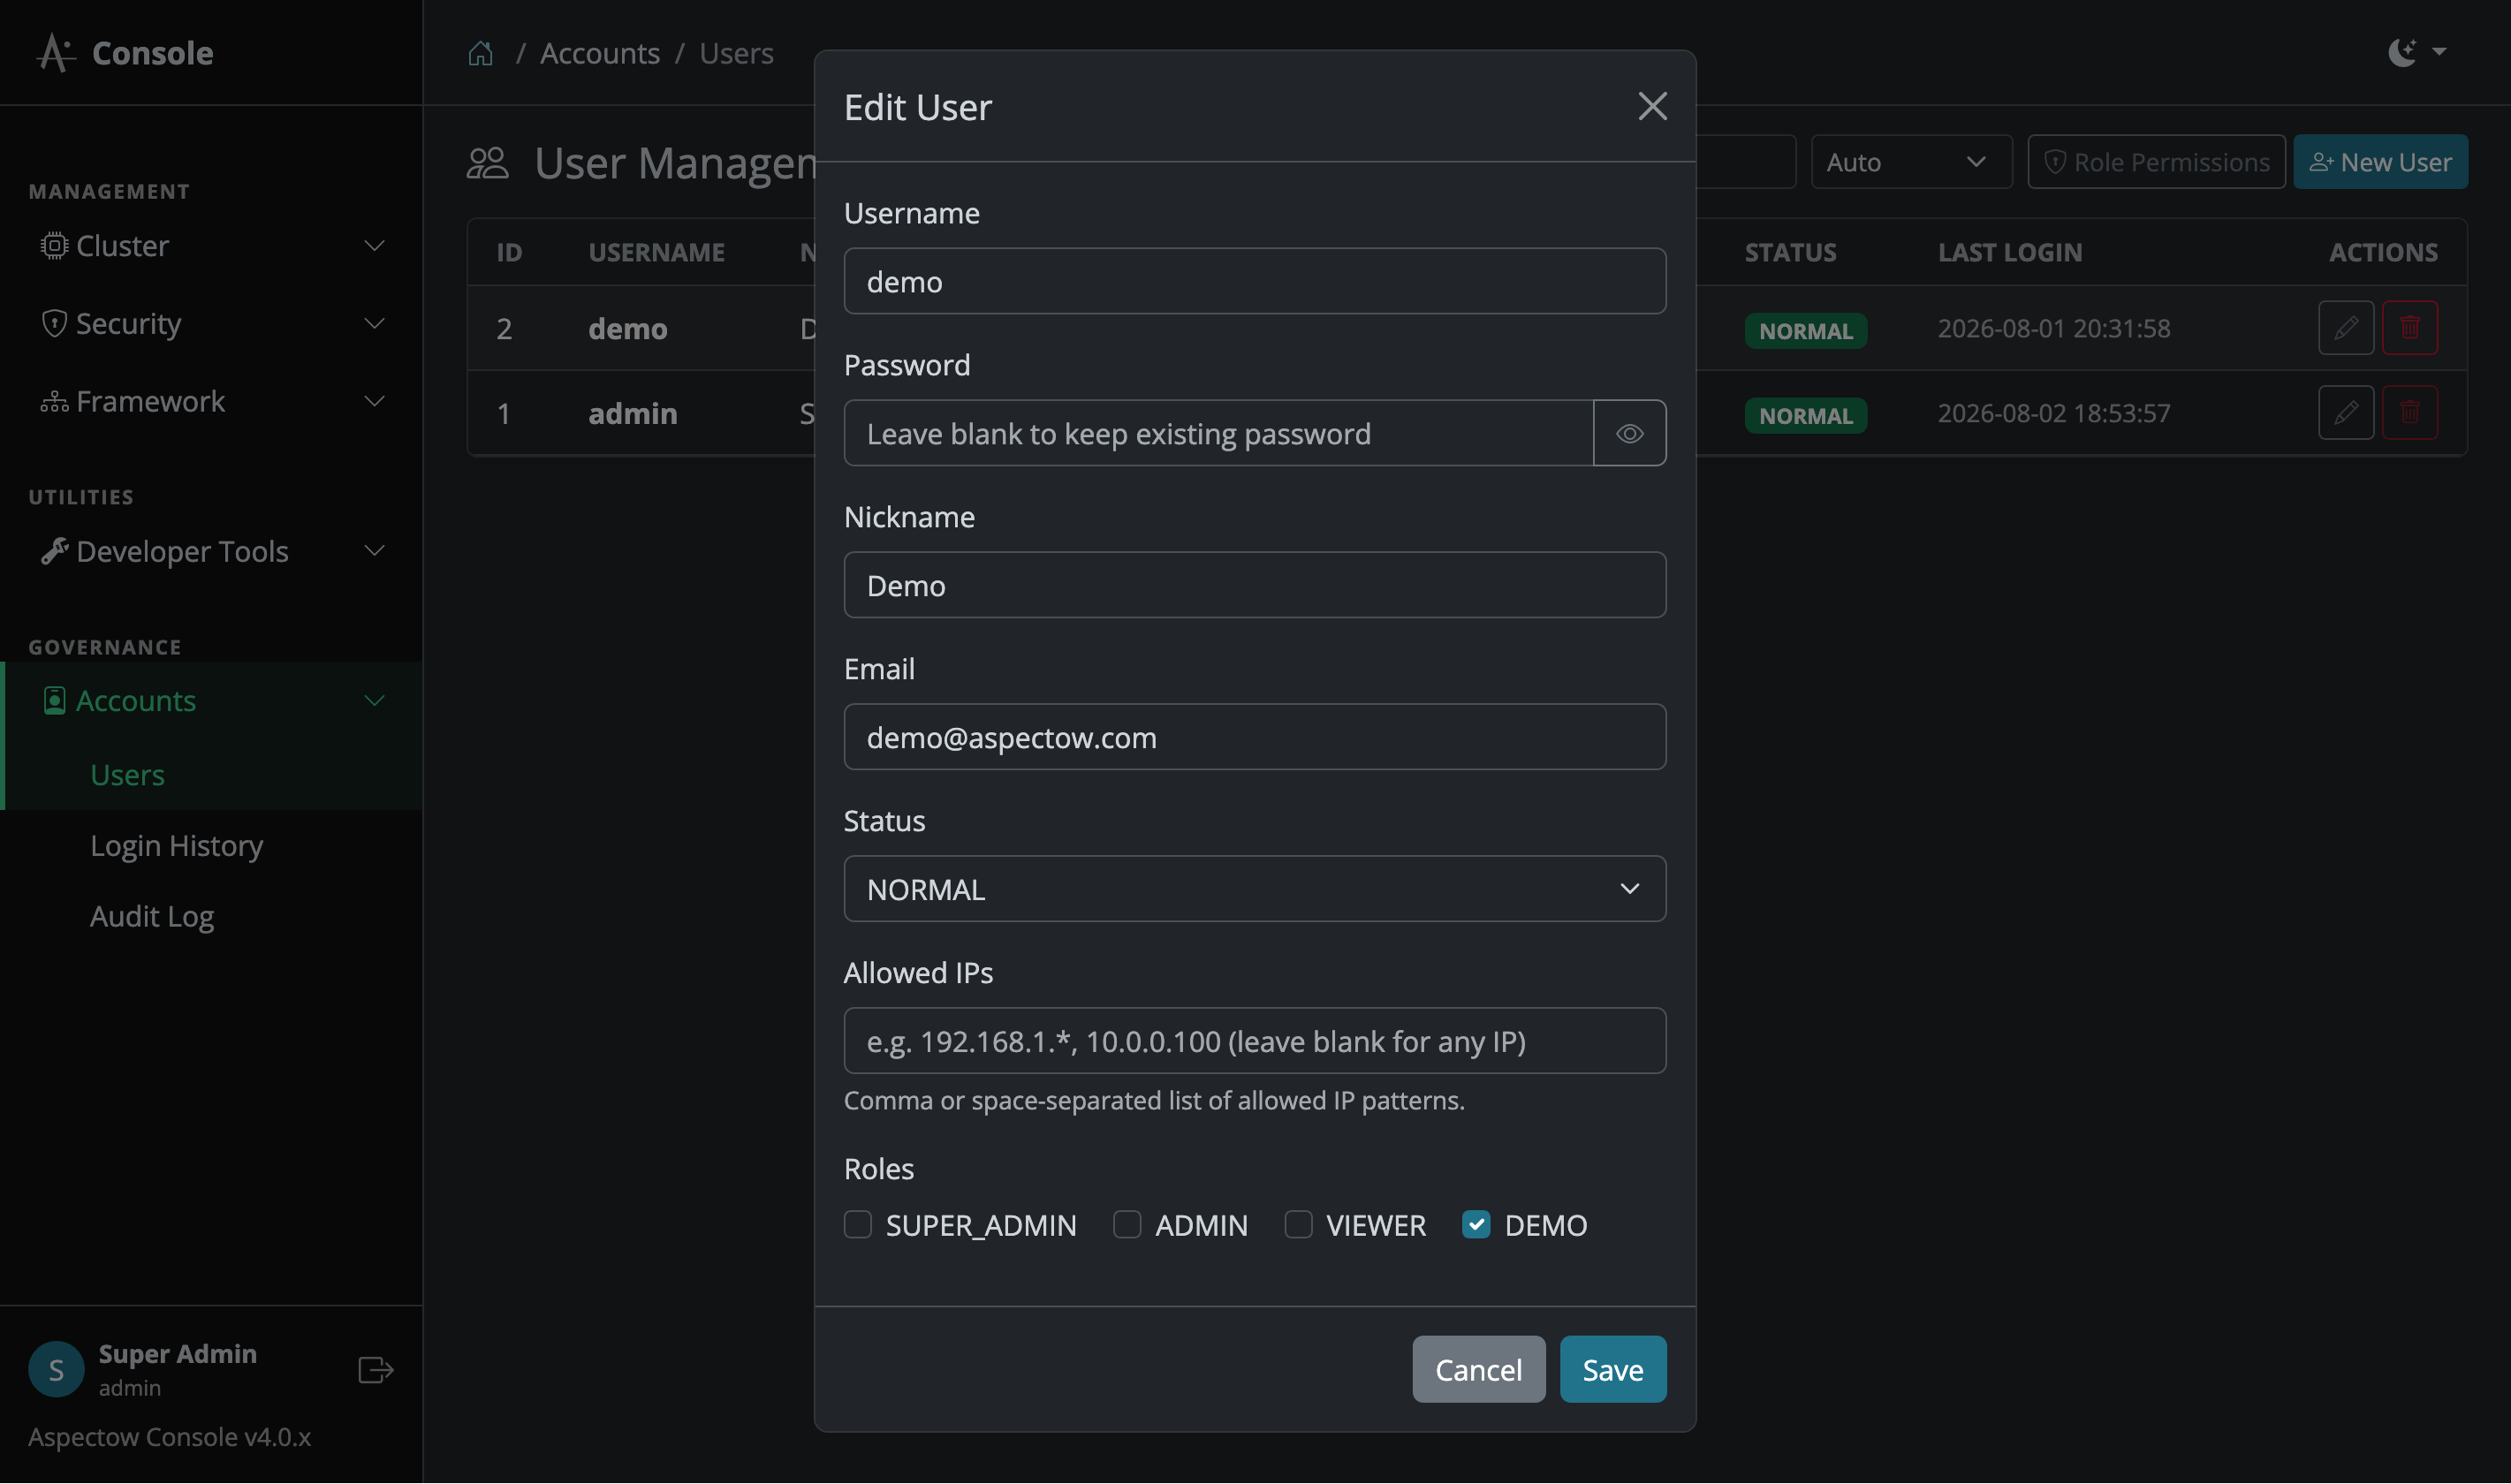
- Basic Account Profile:
Username: Unique account identifier (Protected as Read-only in edit mode).Password: Account password (Required when creating a new user; leave blank during edit mode to preserve existing password. Includes a password visibility toggle icon).Nickname: Display name shown in the console header and profile.Email: Email address for notifications and account identification.Status: Account status (NORMAL,LOCKED,EXPIRED). Accounts locked automatically after consecutive failed login attempts (LOCKED) can be immediately unlocked by setting status toNORMAL, which resets thefailedAttemptscounter back to 0.
- Allowed IP Restrictions (
Allowed IPs) Configuration:- Specifies allowed IP patterns (
allowedIps) for individual operator accounts to prevent unauthorized access strictly. - Supports exact single IPs (
192.168.1.50,10.0.0.100), subnet wildcards (192.168.1.*,10.0.*.*), and comma/space-separated multiple patterns. (Leave blank to permit access from any IP without restriction.) - If an access attempt is made from an unauthorized IP, login is rejected immediately even with correct password credentials and recorded in the security audit log.
- Specifies allowed IP patterns (
- Roles Assignment:
- Assigns user roles via inline checkboxes (multiple roles can be granted).
SUPER_ADMIN: Super administrator with full system-wide access and complete control privileges.ADMIN: Administrator with operational management access (cluster nodes, remote commands, build/deployment).VIEWER: Read-only access to monitoring dashboards and build status.DEMO: Simulation access for demo environments (data modification and deletion restricted).BUILDER: Build and deployment engineer dedicated to CI/CD pipeline executions and audit trail reviews.
Role Permissions Modal

Opened by clicking the Role Permissions button on the top toolbar. It allows administrators with USER_MANAGE permission or SUPER_ADMIN role to dynamically configure and manage fine-grained Role-Based Access Control (RBAC) mappings.
- Role Selector Dropdown:
- Choose a target role to view or modify (
SUPER_ADMIN,ADMIN,BUILDER,VIEWER,DEMO, etc.). - Selecting a role automatically updates and checks the assigned permission checkboxes in real time.
- Choose a target role to view or modify (
- Fine-Grained Permissions List:
MONITOR_VIEW: Access to AppMon live monitoring dashboards, server resource metrics, and live log viewers.MONITOR_CONTROL: Permission to modify monitoring settings and manage active user sessions.USER_MANAGE: Permission to create, edit, delete user accounts and manage role-to-permission mappings.NODE_MANAGE: Permission to monitor cluster nodes and execute Pause, Resume, and Hot Reload / Cold Reboot (Restart) commands.COMMAND_EXECUTE: Permission to execute interactive CLI/Shell scripts via the Remote Command Center.BUILD_VIEW: Permission to inspect build/deployment dashboards, real-time terminal log streams, and audit trails.BUILD_EXECUTE: Permission to checkout Git branches, trigger Maven builds, and execute/abort full or staged deployment scripts.
- Dynamic Permission Persistence (
Save Changes):- After adjusting permission checkboxes, clicking Save Changes immediately updates the
asc_role_permissiondatabase mappings, applying changes to active sessions at runtime without restarting the server.
- After adjusting permission checkboxes, clicking Save Changes immediately updates the
7.2. Login History Audit

Audits login timestamps, client IP addresses, IP Geo Location flag icons, success/failure statuses, error reasons, and User-Agent strings to verify system access security thoroughly.
7.3. Security Audit Log
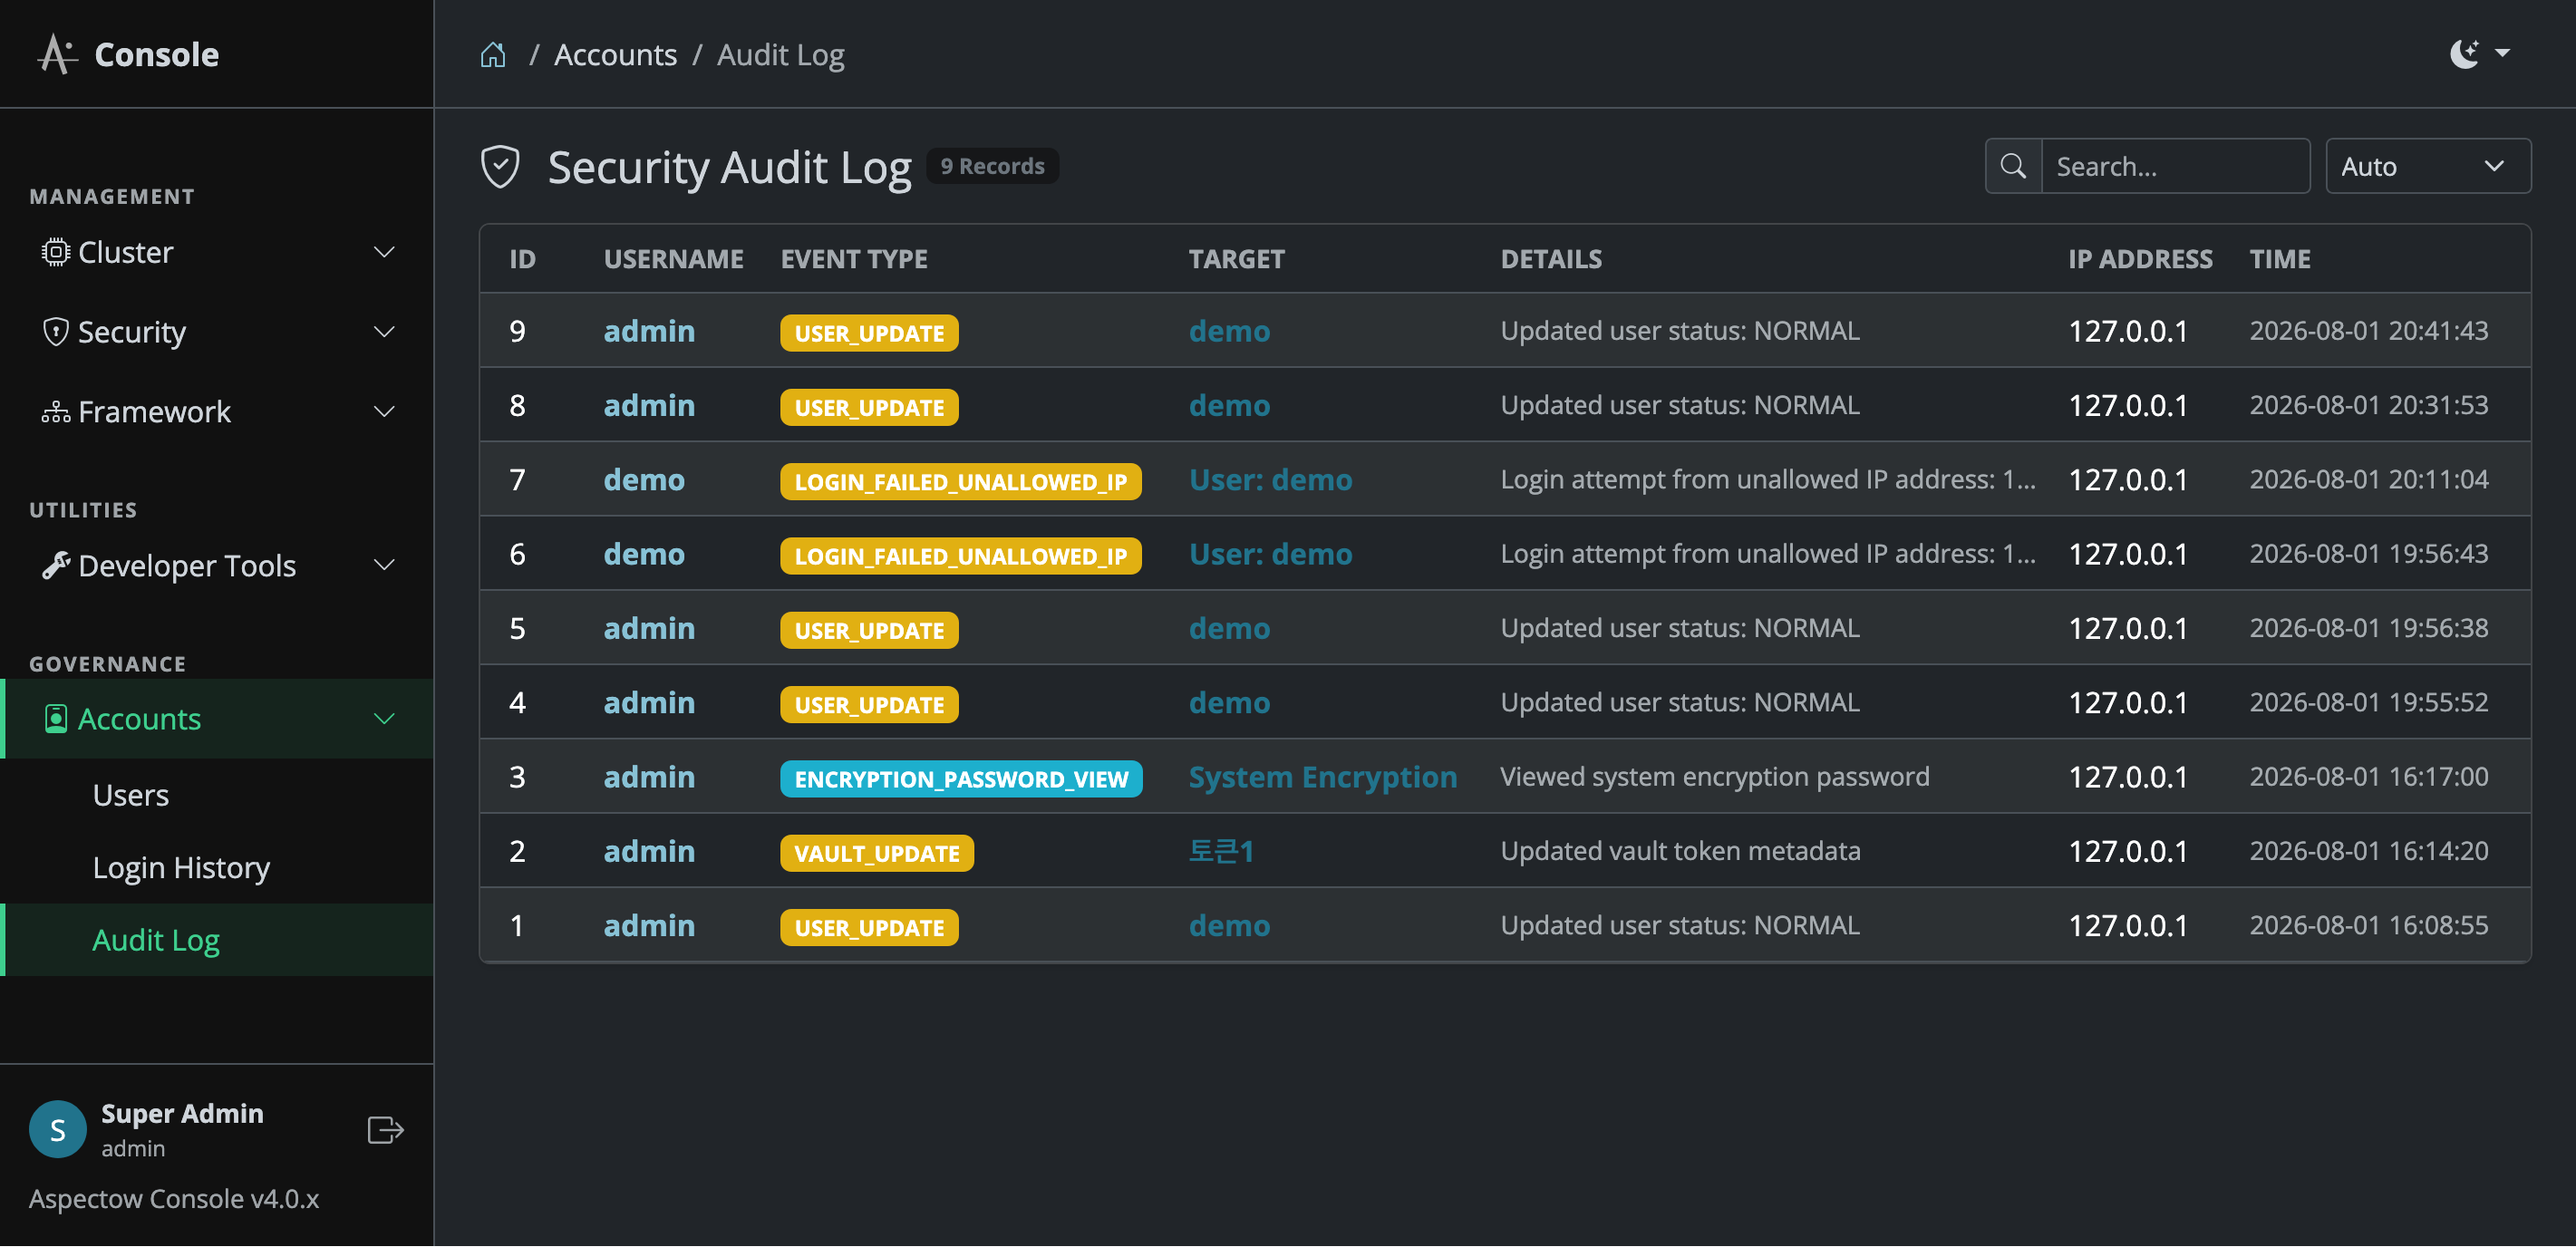
A security monitoring screen tracking and auditing high-risk administrative operations, account modifications, and Vault security token management in real time.
- Real-time Audited Security Events:
- User account creation, modification, deletion, and lockout/unlock events.
- Role and pinpoint permission updates.
- Vault security token issuance, editing, revocation, and System Encryption queries.
- Blocked login attempts from unauthorized IP addresses and failed attempt tracking.
- Search & Filtering: Filters audit logs by executor username, action keyword, execution status (Success/Failed), and date range.
- Audit Details Modal: Clicking an entry opens a detail modal rendering executor ID, client IP address, target resource, pre/post-change data payloads, and detailed reasons in a JSON/text viewer for security incident investigations.